

130
9 Materials Near the Layered Boundary
Table 9.2 X-ray diffraction (XRD) Rietveld refinement results for samples along the composition
line Li 1+x [Ni 0.5 Mn 0.5 ] 1−x O 2 with 0 ≤ x ≤ 0.24. The capacity is the average first cycle discharge
capacity for two twin cells cycled over the range 2.5–4.4 V at 10 mA/g
Sample
x
a
c
Ni Li
Single
Capacity
(± 0.0004 Å)
(± 0.002 Å)
(%)
phase
(mAh/g)
LiNi 0.5 Mn 0.5 O 2
0.00
2.8944
14.311
10.0
No
129.7(7)
Li 1.04 Ni 0.48 Mn 0.48 O 2
0.04
2.8890
14.307
9.0
Yes
160.3(5)
Li 1.08 Ni 0.46 Mn 0.46 O 2
0.08
2.8816
14.293
7.4
Yes
149.9(7)
Li 1.12 Ni 0.44 Mn 0.44 O 2
0.12
2.8765
14.279
5.0
Yes
142(1)
Li 1.16 Ni 0.42 Mn 0.42 O 2
0.16
2.8704
14.255
3.7
Yes
134.3(5)
Li 1.20 Ni 0.4 Mn 0.4 O 2
0.20
2.8678
14.250
2.2
No
a
129.7(5)
Li 1.24 Ni 0.38 Mn 0.38 O 2
0.24
2.8679
14.242
0.7
No
a
121(2)
a This coexistence is between the layered material and unreacted Li 2 CO 3
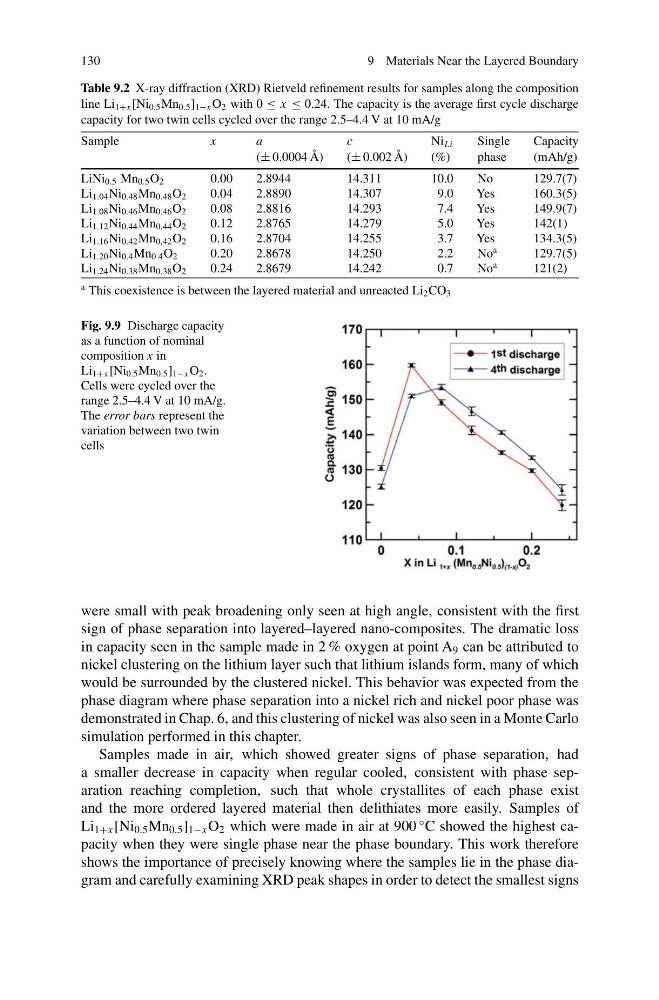
Fig. 9.9 Discharge capacity
as a function of nominal
composition x in
Li 1+x [Ni 0.5 Mn 0.5 ] 1−x O 2 .
Cells were cycled over the
range 2.5–4.4 V at 10 mA/g.
The error bars represent the
variation between two twin
cells
were small with peak broadening only seen at high angle, consistent with the first
sign of phase separation into layered–layered nano-composites. The dramatic loss
in capacity seen in the sample made in 2 % oxygen at point A 9 can be attributed to
nickel clustering on the lithium layer such that lithium islands form, many of which
would be surrounded by the clustered nickel. This behavior was expected from the
phase diagram where phase separation into a nickel rich and nickel poor phase was
demonstrated in Chap. 6, and this clustering of nickel was also seen in a Monte Carlo
simulation performed in this chapter.
Samples made in air, which showed greater signs of phase separation, had
a smaller decrease in capacity when regular cooled, consistent with phase separation reaching completion, such that whole crystallites of each phase exist
and the more ordered layered material then delithiates more easily. Samples of
Li 1+x [Ni 0.5 Mn 0.5 ] 1−x O 2 which were made in air at 900
◦ C showed the highest capacity when they were single phase near the phase boundary. This work therefore
shows the importance of precisely knowing where the samples lie in the phase diagram and carefully examining XRD peak shapes in order to detect the smallest signs
9 Materials Near the Layered Boundary
Table 9.2 X-ray diffraction (XRD) Rietveld refinement results for samples along the composition
line Li 1+x [Ni 0.5 Mn 0.5 ] 1−x O 2 with 0 ≤ x ≤ 0.24. The capacity is the average first cycle discharge
capacity for two twin cells cycled over the range 2.5–4.4 V at 10 mA/g
Sample
x
a
c
Ni Li
Single
Capacity
(± 0.0004 Å)
(± 0.002 Å)
(%)
phase
(mAh/g)
LiNi 0.5 Mn 0.5 O 2
0.00
2.8944
14.311
10.0
No
129.7(7)
Li 1.04 Ni 0.48 Mn 0.48 O 2
0.04
2.8890
14.307
9.0
Yes
160.3(5)
Li 1.08 Ni 0.46 Mn 0.46 O 2
0.08
2.8816
14.293
7.4
Yes
149.9(7)
Li 1.12 Ni 0.44 Mn 0.44 O 2
0.12
2.8765
14.279
5.0
Yes
142(1)
Li 1.16 Ni 0.42 Mn 0.42 O 2
0.16
2.8704
14.255
3.7
Yes
134.3(5)
Li 1.20 Ni 0.4 Mn 0.4 O 2
0.20
2.8678
14.250
2.2
No
a
129.7(5)
Li 1.24 Ni 0.38 Mn 0.38 O 2
0.24
2.8679
14.242
0.7
No
a
121(2)
a This coexistence is between the layered material and unreacted Li 2 CO 3
Fig. 9.9 Discharge capacity
as a function of nominal
composition x in
Li 1+x [Ni 0.5 Mn 0.5 ] 1−x O 2 .
Cells were cycled over the
range 2.5–4.4 V at 10 mA/g.
The error bars represent the
variation between two twin
cells
were small with peak broadening only seen at high angle, consistent with the first
sign of phase separation into layered–layered nano-composites. The dramatic loss
in capacity seen in the sample made in 2 % oxygen at point A 9 can be attributed to
nickel clustering on the lithium layer such that lithium islands form, many of which
would be surrounded by the clustered nickel. This behavior was expected from the
phase diagram where phase separation into a nickel rich and nickel poor phase was
demonstrated in Chap. 6, and this clustering of nickel was also seen in a Monte Carlo
simulation performed in this chapter.
Samples made in air, which showed greater signs of phase separation, had
a smaller decrease in capacity when regular cooled, consistent with phase separation reaching completion, such that whole crystallites of each phase exist
and the more ordered layered material then delithiates more easily. Samples of
Li 1+x [Ni 0.5 Mn 0.5 ] 1−x O 2 which were made in air at 900
◦ C showed the highest capacity when they were single phase near the phase boundary. This work therefore
shows the importance of precisely knowing where the samples lie in the phase diagram and carefully examining XRD peak shapes in order to detect the smallest signs