

118
9 Materials Near the Layered Boundary
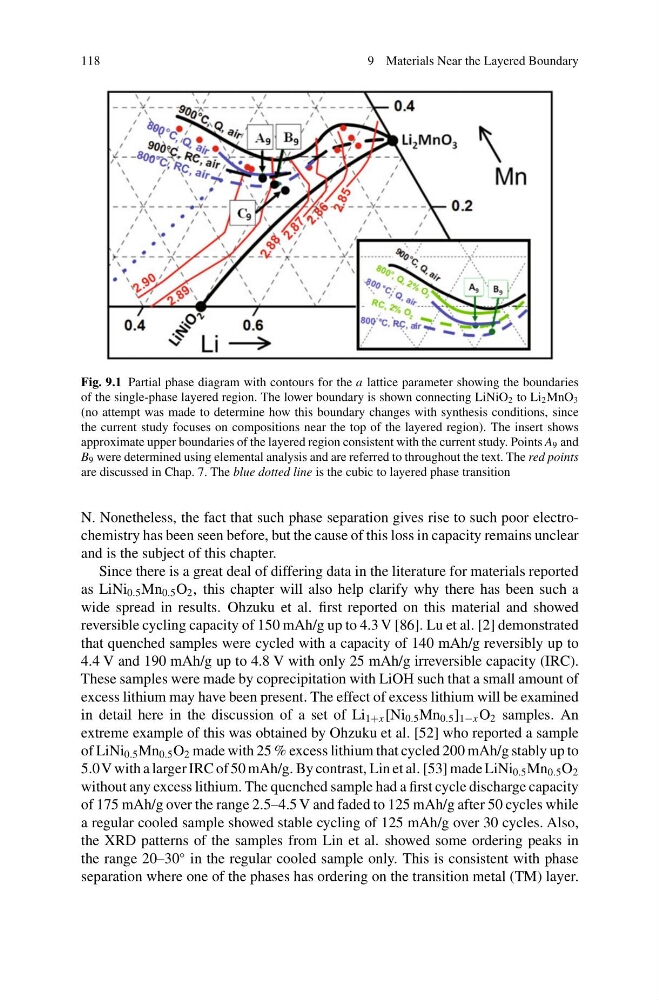
Fig. 9.1 Partial phase diagram with contours for the a lattice parameter showing the boundaries
of the single-phase layered region. The lower boundary is shown connecting LiNiO 2 to Li 2 MnO 3
(no attempt was made to determine how this boundary changes with synthesis conditions, since
the current study focuses on compositions near the top of the layered region). The insert shows
approximate upper boundaries of the layered region consistent with the current study. Points A 9 and
B 9 were determined using elemental analysis and are referred to throughout the text. The red points
are discussed in Chap. 7. The blue dotted line is the cubic to layered phase transition
N. Nonetheless, the fact that such phase separation gives rise to such poor electrochemistry has been seen before, but the cause of this loss in capacity remains unclear
and is the subject of this chapter.
Since there is a great deal of differing data in the literature for materials reported
as LiNi 0.5 Mn 0.5 O 2 , this chapter will also help clarify why there has been such a
wide spread in results. Ohzuku et al. first reported on this material and showed
reversible cycling capacity of 150 mAh/g up to 4.3 V [86]. Lu et al. [2] demonstrated
that quenched samples were cycled with a capacity of 140 mAh/g reversibly up to
4.4 V and 190 mAh/g up to 4.8 V with only 25 mAh/g irreversible capacity (IRC).
These samples were made by coprecipitation with LiOH such that a small amount of
excess lithium may have been present. The effect of excess lithium will be examined
in detail here in the discussion of a set of Li 1+x [Ni 0.5 Mn 0.5 ] 1−x O 2 samples. An
extreme example of this was obtained by Ohzuku et al. [52] who reported a sample
of LiNi 0.5 Mn 0.5 O 2 made with 25 % excess lithium that cycled 200 mAh/g stably up to
5.0 V with a larger IRC of 50 mAh/g. By contrast, Lin et al. [53] made LiNi 0.5 Mn 0.5 O 2
without any excess lithium. The quenched sample had a first cycle discharge capacity
of 175 mAh/g over the range 2.5–4.5 V and faded to 125 mAh/g after 50 cycles while
a regular cooled sample showed stable cycling of 125 mAh/g over 30 cycles. Also,
the XRD patterns of the samples from Lin et al. showed some ordering peaks in
the range 20–30
◦ in the regular cooled sample only. This is consistent with phase
separation where one of the phases has ordering on the transition metal (TM) layer.
9 Materials Near the Layered Boundary
Fig. 9.1 Partial phase diagram with contours for the a lattice parameter showing the boundaries
of the single-phase layered region. The lower boundary is shown connecting LiNiO 2 to Li 2 MnO 3
(no attempt was made to determine how this boundary changes with synthesis conditions, since
the current study focuses on compositions near the top of the layered region). The insert shows
approximate upper boundaries of the layered region consistent with the current study. Points A 9 and
B 9 were determined using elemental analysis and are referred to throughout the text. The red points
are discussed in Chap. 7. The blue dotted line is the cubic to layered phase transition
N. Nonetheless, the fact that such phase separation gives rise to such poor electrochemistry has been seen before, but the cause of this loss in capacity remains unclear
and is the subject of this chapter.
Since there is a great deal of differing data in the literature for materials reported
as LiNi 0.5 Mn 0.5 O 2 , this chapter will also help clarify why there has been such a
wide spread in results. Ohzuku et al. first reported on this material and showed
reversible cycling capacity of 150 mAh/g up to 4.3 V [86]. Lu et al. [2] demonstrated
that quenched samples were cycled with a capacity of 140 mAh/g reversibly up to
4.4 V and 190 mAh/g up to 4.8 V with only 25 mAh/g irreversible capacity (IRC).
These samples were made by coprecipitation with LiOH such that a small amount of
excess lithium may have been present. The effect of excess lithium will be examined
in detail here in the discussion of a set of Li 1+x [Ni 0.5 Mn 0.5 ] 1−x O 2 samples. An
extreme example of this was obtained by Ohzuku et al. [52] who reported a sample
of LiNi 0.5 Mn 0.5 O 2 made with 25 % excess lithium that cycled 200 mAh/g stably up to
5.0 V with a larger IRC of 50 mAh/g. By contrast, Lin et al. [53] made LiNi 0.5 Mn 0.5 O 2
without any excess lithium. The quenched sample had a first cycle discharge capacity
of 175 mAh/g over the range 2.5–4.5 V and faded to 125 mAh/g after 50 cycles while
a regular cooled sample showed stable cycling of 125 mAh/g over 30 cycles. Also,
the XRD patterns of the samples from Lin et al. showed some ordering peaks in
the range 20–30
◦ in the regular cooled sample only. This is consistent with phase
separation where one of the phases has ordering on the transition metal (TM) layer.