

82
6 Combinatorial Studies of Compositions Containing Layered Phases . . .
Fig. 6.7 XRD scans in the
two-phase region below the
NM line obtained for
quenched samples.
Compositions of samples J 6
and K 6 are indicated on
Fig. 6.5
but nonetheless the boundary generated in Sect. 6.8 to fit the points obtained by the
lever rule is consistent with all but one of these data points and this one anomalous
point is within uncertainty of the boundary.
6.4 Two-Phase Layered–Layered Region
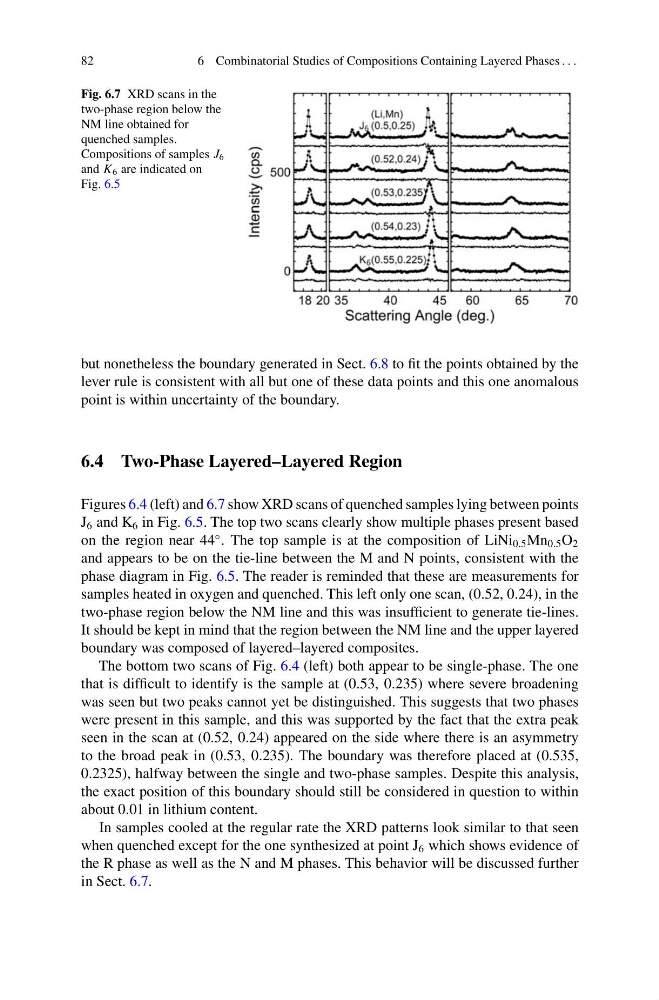
Figures 6.4 (left) and 6.7 show XRD scans of quenched samples lying between points
J 6 and K 6 in Fig. 6.5. The top two scans clearly show multiple phases present based
on the region near 44
◦ . The top sample is at the composition of LiNi 0.5 Mn 0.5 O 2
and appears to be on the tie-line between the M and N points, consistent with the
phase diagram in Fig. 6.5. The reader is reminded that these are measurements for
samples heated in oxygen and quenched. This left only one scan, (0.52, 0.24), in the
two-phase region below the NM line and this was insufficient to generate tie-lines.
It should be kept in mind that the region between the NM line and the upper layered
boundary was composed of layered–layered composites.
The bottom two scans of Fig. 6.4 (left) both appear to be single-phase. The one
that is difficult to identify is the sample at (0.53, 0.235) where severe broadening
was seen but two peaks cannot yet be distinguished. This suggests that two phases
were present in this sample, and this was supported by the fact that the extra peak
seen in the scan at (0.52, 0.24) appeared on the side where there is an asymmetry
to the broad peak in (0.53, 0.235). The boundary was therefore placed at (0.535,
0.2325), halfway between the single and two-phase samples. Despite this analysis,
the exact position of this boundary should still be considered in question to within
about 0.01 in lithium content.
In samples cooled at the regular rate the XRD patterns look similar to that seen
when quenched except for the one synthesized at point J 6 which shows evidence of
the R phase as well as the N and M phases. This behavior will be discussed further
in Sect. 6.7.
6 Combinatorial Studies of Compositions Containing Layered Phases . . .
Fig. 6.7 XRD scans in the
two-phase region below the
NM line obtained for
quenched samples.
Compositions of samples J 6
and K 6 are indicated on
Fig. 6.5
but nonetheless the boundary generated in Sect. 6.8 to fit the points obtained by the
lever rule is consistent with all but one of these data points and this one anomalous
point is within uncertainty of the boundary.
6.4 Two-Phase Layered–Layered Region
Figures 6.4 (left) and 6.7 show XRD scans of quenched samples lying between points
J 6 and K 6 in Fig. 6.5. The top two scans clearly show multiple phases present based
on the region near 44
◦ . The top sample is at the composition of LiNi 0.5 Mn 0.5 O 2
and appears to be on the tie-line between the M and N points, consistent with the
phase diagram in Fig. 6.5. The reader is reminded that these are measurements for
samples heated in oxygen and quenched. This left only one scan, (0.52, 0.24), in the
two-phase region below the NM line and this was insufficient to generate tie-lines.
It should be kept in mind that the region between the NM line and the upper layered
boundary was composed of layered–layered composites.
The bottom two scans of Fig. 6.4 (left) both appear to be single-phase. The one
that is difficult to identify is the sample at (0.53, 0.235) where severe broadening
was seen but two peaks cannot yet be distinguished. This suggests that two phases
were present in this sample, and this was supported by the fact that the extra peak
seen in the scan at (0.52, 0.24) appeared on the side where there is an asymmetry
to the broad peak in (0.53, 0.235). The boundary was therefore placed at (0.535,
0.2325), halfway between the single and two-phase samples. Despite this analysis,
the exact position of this boundary should still be considered in question to within
about 0.01 in lithium content.
In samples cooled at the regular rate the XRD patterns look similar to that seen
when quenched except for the one synthesized at point J 6 which shows evidence of
the R phase as well as the N and M phases. This behavior will be discussed further
in Sect. 6.7.