

80
6 Combinatorial Studies of Compositions Containing Layered Phases . . .
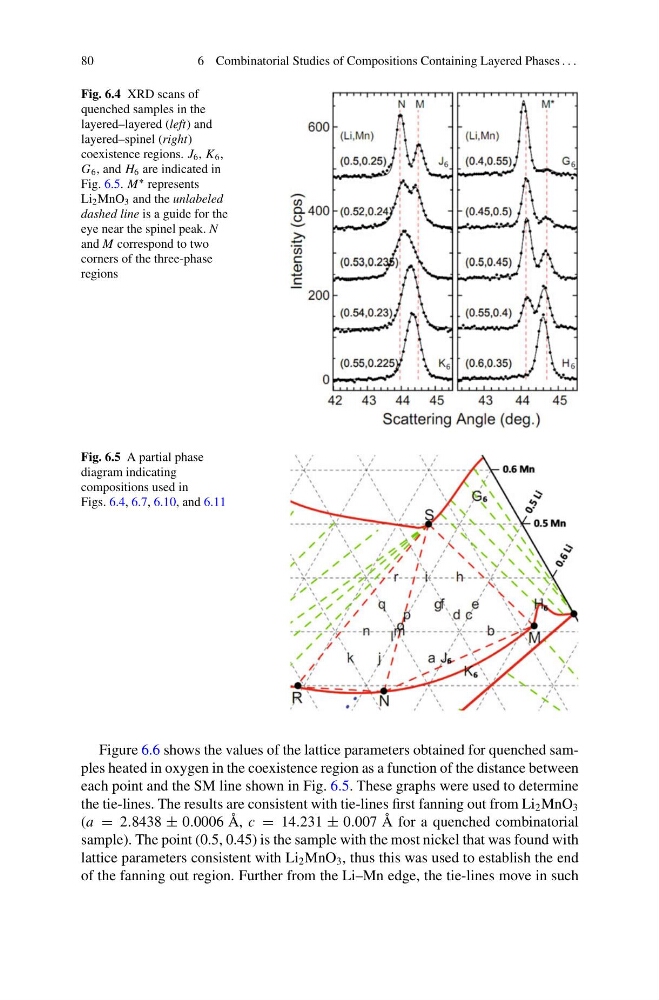
Fig. 6.4 XRD scans of
quenched samples in the
layered–layered (left) and
layered–spinel (right)
coexistence regions. J 6 , K 6 ,
G 6 , and H 6 are indicated in
Fig. 6.5. M
∗ represents
Li 2 MnO 3 and the unlabeled
dashed line is a guide for the
eye near the spinel peak. N
and M correspond to two
corners of the three-phase
regions
Fig. 6.5 A partial phase
diagram indicating
compositions used in
Figs. 6.4, 6.7, 6.10, and 6.11
Figure 6.6 shows the values of the lattice parameters obtained for quenched samples heated in oxygen in the coexistence region as a function of the distance between
each point and the SM line shown in Fig. 6.5. These graphs were used to determine
the tie-lines. The results are consistent with tie-lines first fanning out from Li 2 MnO 3
(a = 2.8438 ± 0.0006 Å, c = 14.231 ± 0.007 Å for a quenched combinatorial
sample). The point (0.5, 0.45) is the sample with the most nickel that was found with
lattice parameters consistent with Li 2 MnO 3 , thus this was used to establish the end
of the fanning out region. Further from the Li–Mn edge, the tie-lines move in such
6 Combinatorial Studies of Compositions Containing Layered Phases . . .
Fig. 6.4 XRD scans of
quenched samples in the
layered–layered (left) and
layered–spinel (right)
coexistence regions. J 6 , K 6 ,
G 6 , and H 6 are indicated in
Fig. 6.5. M
∗ represents
Li 2 MnO 3 and the unlabeled
dashed line is a guide for the
eye near the spinel peak. N
and M correspond to two
corners of the three-phase
regions
Fig. 6.5 A partial phase
diagram indicating
compositions used in
Figs. 6.4, 6.7, 6.10, and 6.11
Figure 6.6 shows the values of the lattice parameters obtained for quenched samples heated in oxygen in the coexistence region as a function of the distance between
each point and the SM line shown in Fig. 6.5. These graphs were used to determine
the tie-lines. The results are consistent with tie-lines first fanning out from Li 2 MnO 3
(a = 2.8438 ± 0.0006 Å, c = 14.231 ± 0.007 Å for a quenched combinatorial
sample). The point (0.5, 0.45) is the sample with the most nickel that was found with
lattice parameters consistent with Li 2 MnO 3 , thus this was used to establish the end
of the fanning out region. Further from the Li–Mn edge, the tie-lines move in such