

78
6 Combinatorial Studies of Compositions Containing Layered Phases . . .
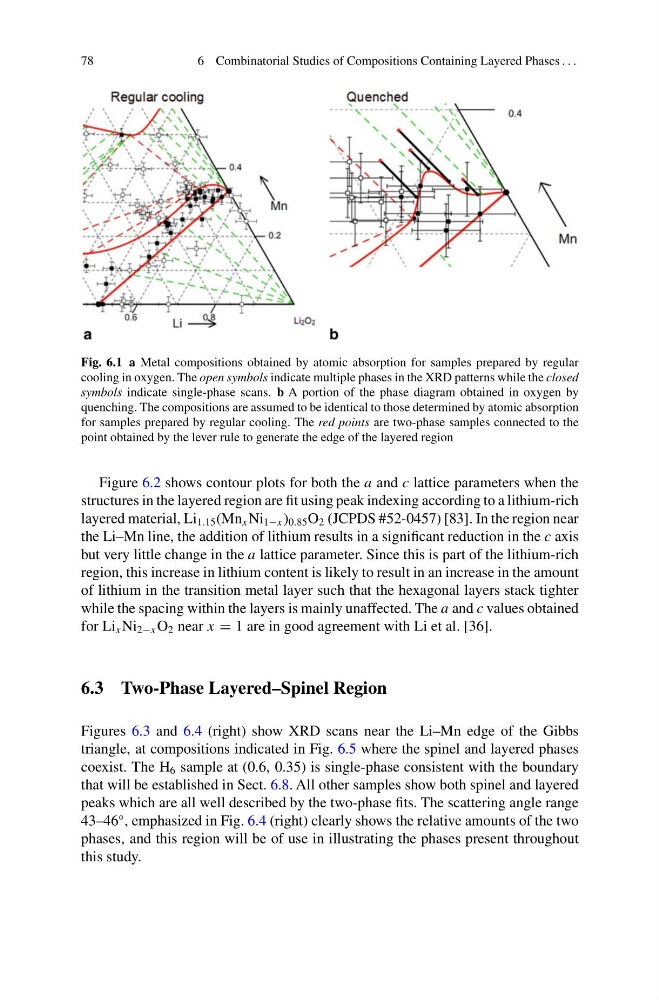
Fig. 6.1 a Metal compositions obtained by atomic absorption for samples prepared by regular
cooling in oxygen. The open symbols indicate multiple phases in the XRD patterns while the closed
symbols indicate single-phase scans. b A portion of the phase diagram obtained in oxygen by
quenching. The compositions are assumed to be identical to those determined by atomic absorption
for samples prepared by regular cooling. The red points are two-phase samples connected to the
point obtained by the lever rule to generate the edge of the layered region
Figure 6.2 shows contour plots for both the a and c lattice parameters when the
structures in the layered region are fit using peak indexing according to a lithium-rich
layered material, Li 1.15 (Mn x Ni 1−x ) 0.85 O 2 (JCPDS #52-0457) [83]. In the region near
the Li–Mn line, the addition of lithium results in a significant reduction in the c axis
but very little change in the a lattice parameter. Since this is part of the lithium-rich
region, this increase in lithium content is likely to result in an increase in the amount
of lithium in the transition metal layer such that the hexagonal layers stack tighter
while the spacing within the layers is mainly unaffected. The a and c values obtained
for Li x Ni 2−x O 2 near x = 1 are in good agreement with Li et al. [36].
6.3 Two-Phase Layered–Spinel Region
Figures 6.3 and 6.4 (right) show XRD scans near the Li–Mn edge of the Gibbs
triangle, at compositions indicated in Fig. 6.5 where the spinel and layered phases
coexist. The H 6 sample at (0.6, 0.35) is single-phase consistent with the boundary
that will be established in Sect. 6.8. All other samples show both spinel and layered
peaks which are all well described by the two-phase fits. The scattering angle range
43–46
◦ , emphasized in Fig. 6.4 (right) clearly shows the relative amounts of the two
phases, and this region will be of use in illustrating the phases present throughout
this study.
6 Combinatorial Studies of Compositions Containing Layered Phases . . .
Fig. 6.1 a Metal compositions obtained by atomic absorption for samples prepared by regular
cooling in oxygen. The open symbols indicate multiple phases in the XRD patterns while the closed
symbols indicate single-phase scans. b A portion of the phase diagram obtained in oxygen by
quenching. The compositions are assumed to be identical to those determined by atomic absorption
for samples prepared by regular cooling. The red points are two-phase samples connected to the
point obtained by the lever rule to generate the edge of the layered region
Figure 6.2 shows contour plots for both the a and c lattice parameters when the
structures in the layered region are fit using peak indexing according to a lithium-rich
layered material, Li 1.15 (Mn x Ni 1−x ) 0.85 O 2 (JCPDS #52-0457) [83]. In the region near
the Li–Mn line, the addition of lithium results in a significant reduction in the c axis
but very little change in the a lattice parameter. Since this is part of the lithium-rich
region, this increase in lithium content is likely to result in an increase in the amount
of lithium in the transition metal layer such that the hexagonal layers stack tighter
while the spacing within the layers is mainly unaffected. The a and c values obtained
for Li x Ni 2−x O 2 near x = 1 are in good agreement with Li et al. [36].
6.3 Two-Phase Layered–Spinel Region
Figures 6.3 and 6.4 (right) show XRD scans near the Li–Mn edge of the Gibbs
triangle, at compositions indicated in Fig. 6.5 where the spinel and layered phases
coexist. The H 6 sample at (0.6, 0.35) is single-phase consistent with the boundary
that will be established in Sect. 6.8. All other samples show both spinel and layered
peaks which are all well described by the two-phase fits. The scattering angle range
43–46
◦ , emphasized in Fig. 6.4 (right) clearly shows the relative amounts of the two
phases, and this region will be of use in illustrating the phases present throughout
this study.