

80
R. de Nalda et al.
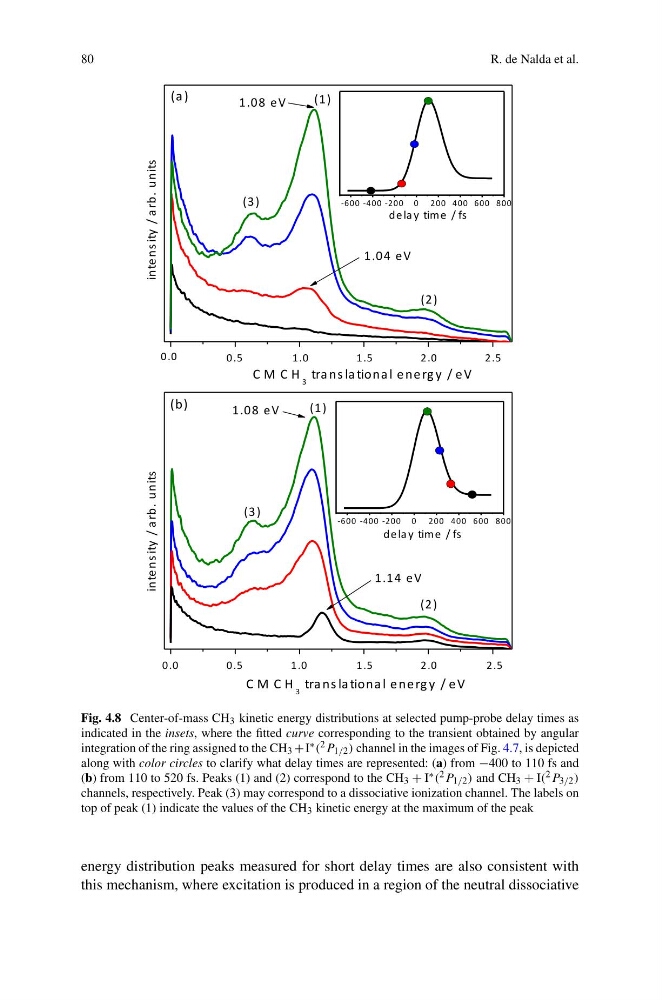
Fig. 4.8 Center-of-mass CH 3 kinetic energy distributions at selected pump-probe delay times as
indicated in the insets, where the fitted curve corresponding to the transient obtained by angular
integration of the ring assigned to the CH 3 + I ∗ ( 2 P 1/2 ) channel in the images of Fig. 4.7, is depicted
along with color circles to clarify what delay times are represented: (a) from −400 to 110 fs and
(b) from 110 to 520 fs. Peaks (1) and (2) correspond to the CH 3 + I ∗ ( 2 P 1/2 ) and CH 3 + I( 2 P 3/2 )
channels, respectively. Peak (3) may correspond to a dissociative ionization channel. The labels on
top of peak (1) indicate the values of the CH 3 kinetic energy at the maximum of the peak
energy distribution peaks measured for short delay times are also consistent with
this mechanism, where excitation is produced in a region of the neutral dissociative
R. de Nalda et al.
Fig. 4.8 Center-of-mass CH 3 kinetic energy distributions at selected pump-probe delay times as
indicated in the insets, where the fitted curve corresponding to the transient obtained by angular
integration of the ring assigned to the CH 3 + I ∗ ( 2 P 1/2 ) channel in the images of Fig. 4.7, is depicted
along with color circles to clarify what delay times are represented: (a) from −400 to 110 fs and
(b) from 110 to 520 fs. Peaks (1) and (2) correspond to the CH 3 + I ∗ ( 2 P 1/2 ) and CH 3 + I( 2 P 3/2 )
channels, respectively. Peak (3) may correspond to a dissociative ionization channel. The labels on
top of peak (1) indicate the values of the CH 3 kinetic energy at the maximum of the peak
energy distribution peaks measured for short delay times are also consistent with
this mechanism, where excitation is produced in a region of the neutral dissociative