

44
A. Palacios et al.
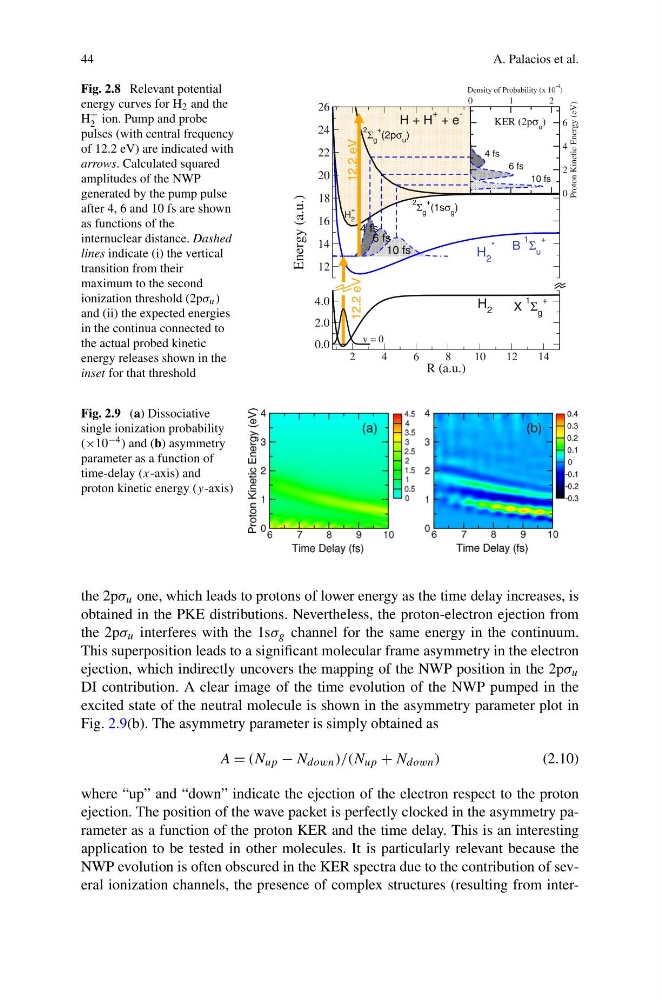
Fig. 2.8 Relevant potential
energy curves for H 2 and the
H
+
2 ion. Pump and probe
pulses (with central frequency
of 12.2 eV) are indicated with
arrows. Calculated squared
amplitudes of the NWP
generated by the pump pulse
after 4, 6 and 10 fs are shown
as functions of the
internuclear distance. Dashed
lines indicate (i) the vertical
transition from their
maximum to the second
ionization threshold (2pσ u )
and (ii) the expected energies
in the continua connected to
the actual probed kinetic
energy releases shown in the
inset for that threshold
Fig. 2.9 (a) Dissociative
single ionization probability
(×10 −4 ) and (b) asymmetry
parameter as a function of
time-delay (x-axis) and
proton kinetic energy (y-axis)
the 2pσ u one, which leads to protons of lower energy as the time delay increases, is
obtained in the PKE distributions. Nevertheless, the proton-electron ejection from
the 2pσ u interferes with the 1sσ g channel for the same energy in the continuum.
This superposition leads to a significant molecular frame asymmetry in the electron
ejection, which indirectly uncovers the mapping of the NWP position in the 2pσ u
DI contribution. A clear image of the time evolution of the NWP pumped in the
excited state of the neutral molecule is shown in the asymmetry parameter plot in
Fig. 2.9(b). The asymmetry parameter is simply obtained as
A = (N up − N down )/(N up + N down )
(2.10)
where “up” and “down” indicate the ejection of the electron respect to the proton
ejection. The position of the wave packet is perfectly clocked in the asymmetry parameter as a function of the proton KER and the time delay. This is an interesting
application to be tested in other molecules. It is particularly relevant because the
NWP evolution is often obscured in the KER spectra due to the contribution of several ionization channels, the presence of complex structures (resulting from inter-
A. Palacios et al.
Fig. 2.8 Relevant potential
energy curves for H 2 and the
H
+
2 ion. Pump and probe
pulses (with central frequency
of 12.2 eV) are indicated with
arrows. Calculated squared
amplitudes of the NWP
generated by the pump pulse
after 4, 6 and 10 fs are shown
as functions of the
internuclear distance. Dashed
lines indicate (i) the vertical
transition from their
maximum to the second
ionization threshold (2pσ u )
and (ii) the expected energies
in the continua connected to
the actual probed kinetic
energy releases shown in the
inset for that threshold
Fig. 2.9 (a) Dissociative
single ionization probability
(×10 −4 ) and (b) asymmetry
parameter as a function of
time-delay (x-axis) and
proton kinetic energy (y-axis)
the 2pσ u one, which leads to protons of lower energy as the time delay increases, is
obtained in the PKE distributions. Nevertheless, the proton-electron ejection from
the 2pσ u interferes with the 1sσ g channel for the same energy in the continuum.
This superposition leads to a significant molecular frame asymmetry in the electron
ejection, which indirectly uncovers the mapping of the NWP position in the 2pσ u
DI contribution. A clear image of the time evolution of the NWP pumped in the
excited state of the neutral molecule is shown in the asymmetry parameter plot in
Fig. 2.9(b). The asymmetry parameter is simply obtained as
A = (N up − N down )/(N up + N down )
(2.10)
where “up” and “down” indicate the ejection of the electron respect to the proton
ejection. The position of the wave packet is perfectly clocked in the asymmetry parameter as a function of the proton KER and the time delay. This is an interesting
application to be tested in other molecules. It is particularly relevant because the
NWP evolution is often obscured in the KER spectra due to the contribution of several ionization channels, the presence of complex structures (resulting from inter-