

208
T. Buckup et al.
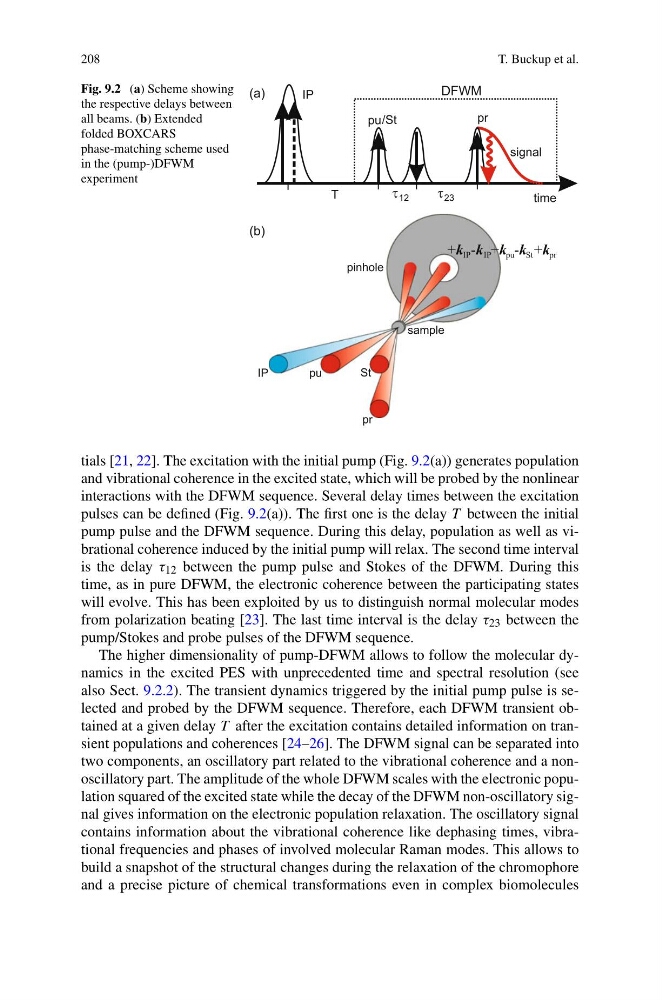
Fig. 9.2 (a) Scheme showing
the respective delays between
all beams. (b) Extended
folded BOXCARS
phase-matching scheme used
in the (pump-)DFWM
experiment
tials [21, 22]. The excitation with the initial pump (Fig. 9.2(a)) generates population
and vibrational coherence in the excited state, which will be probed by the nonlinear
interactions with the DFWM sequence. Several delay times between the excitation
pulses can be defined (Fig. 9.2(a)). The first one is the delay T between the initial
pump pulse and the DFWM sequence. During this delay, population as well as vibrational coherence induced by the initial pump will relax. The second time interval
is the delay τ 12 between the pump pulse and Stokes of the DFWM. During this
time, as in pure DFWM, the electronic coherence between the participating states
will evolve. This has been exploited by us to distinguish normal molecular modes
from polarization beating [23]. The last time interval is the delay τ 23 between the
pump/Stokes and probe pulses of the DFWM sequence.
The higher dimensionality of pump-DFWM allows to follow the molecular dynamics in the excited PES with unprecedented time and spectral resolution (see
also Sect. 9.2.2). The transient dynamics triggered by the initial pump pulse is selected and probed by the DFWM sequence. Therefore, each DFWM transient obtained at a given delay T after the excitation contains detailed information on transient populations and coherences [24–26]. The DFWM signal can be separated into
two components, an oscillatory part related to the vibrational coherence and a nonoscillatory part. The amplitude of the whole DFWM scales with the electronic population squared of the excited state while the decay of the DFWM non-oscillatory signal gives information on the electronic population relaxation. The oscillatory signal
contains information about the vibrational coherence like dephasing times, vibrational frequencies and phases of involved molecular Raman modes. This allows to
build a snapshot of the structural changes during the relaxation of the chromophore
and a precise picture of chemical transformations even in complex biomolecules
T. Buckup et al.
Fig. 9.2 (a) Scheme showing
the respective delays between
all beams. (b) Extended
folded BOXCARS
phase-matching scheme used
in the (pump-)DFWM
experiment
tials [21, 22]. The excitation with the initial pump (Fig. 9.2(a)) generates population
and vibrational coherence in the excited state, which will be probed by the nonlinear
interactions with the DFWM sequence. Several delay times between the excitation
pulses can be defined (Fig. 9.2(a)). The first one is the delay T between the initial
pump pulse and the DFWM sequence. During this delay, population as well as vibrational coherence induced by the initial pump will relax. The second time interval
is the delay τ 12 between the pump pulse and Stokes of the DFWM. During this
time, as in pure DFWM, the electronic coherence between the participating states
will evolve. This has been exploited by us to distinguish normal molecular modes
from polarization beating [23]. The last time interval is the delay τ 23 between the
pump/Stokes and probe pulses of the DFWM sequence.
The higher dimensionality of pump-DFWM allows to follow the molecular dynamics in the excited PES with unprecedented time and spectral resolution (see
also Sect. 9.2.2). The transient dynamics triggered by the initial pump pulse is selected and probed by the DFWM sequence. Therefore, each DFWM transient obtained at a given delay T after the excitation contains detailed information on transient populations and coherences [24–26]. The DFWM signal can be separated into
two components, an oscillatory part related to the vibrational coherence and a nonoscillatory part. The amplitude of the whole DFWM scales with the electronic population squared of the excited state while the decay of the DFWM non-oscillatory signal gives information on the electronic population relaxation. The oscillatory signal
contains information about the vibrational coherence like dephasing times, vibrational frequencies and phases of involved molecular Raman modes. This allows to
build a snapshot of the structural changes during the relaxation of the chromophore
and a precise picture of chemical transformations even in complex biomolecules