

4 Femtosecond Photodissociation Dynamics by Velocity Map Imaging
87
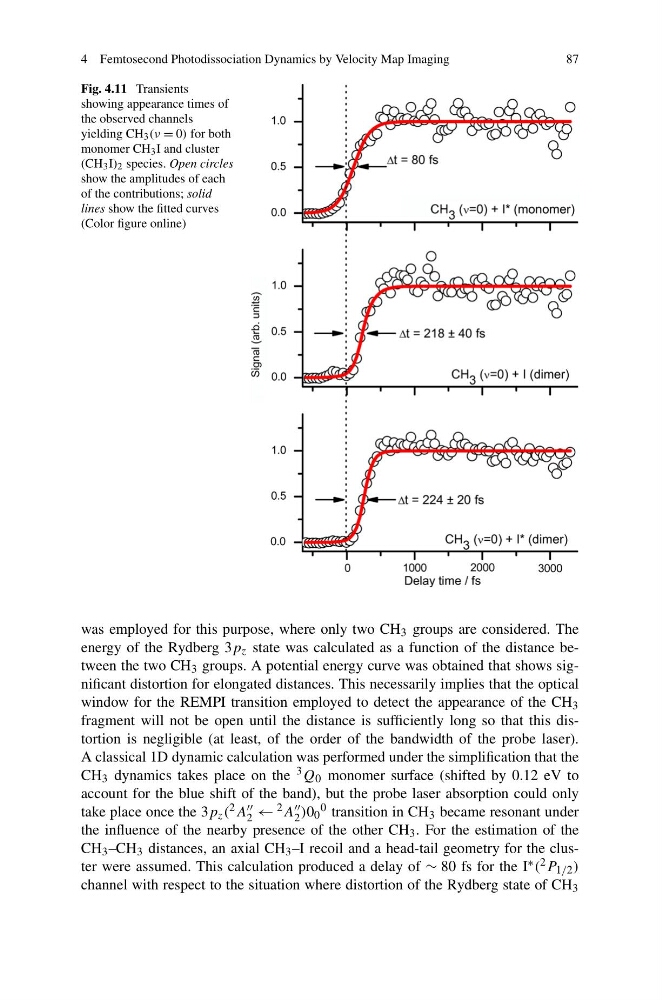
Fig. 4.11 Transients
showing appearance times of
the observed channels
yielding CH 3 (ν = 0) for both
monomer CH 3 I and cluster
(CH 3 I) 2 species. Open circles
show the amplitudes of each
of the contributions; solid
lines show the fitted curves
(Color figure online)
was employed for this purpose, where only two CH 3 groups are considered. The
energy of the Rydberg 3p z state was calculated as a function of the distance between the two CH 3 groups. A potential energy curve was obtained that shows significant distortion for elongated distances. This necessarily implies that the optical
window for the REMPI transition employed to detect the appearance of the CH 3
fragment will not be open until the distance is sufficiently long so that this distortion is negligible (at least, of the order of the bandwidth of the probe laser).
A classical 1D dynamic calculation was performed under the simplification that the
CH 3 dynamics takes place on the 3 Q 0 monomer surface (shifted by 0.12 eV to
account for the blue shift of the band), but the probe laser absorption could only
take place once the 3p z ( 2 A
2 ← 2 A
2 )0 0
0 transition in CH 3 became resonant under
the influence of the nearby presence of the other CH 3 . For the estimation of the
CH 3 –CH 3 distances, an axial CH 3 –I recoil and a head-tail geometry for the cluster were assumed. This calculation produced a delay of ∼ 80 fs for the I ∗ ( 2 P 1/2 )
channel with respect to the situation where distortion of the Rydberg state of CH 3
87
Fig. 4.11 Transients
showing appearance times of
the observed channels
yielding CH 3 (ν = 0) for both
monomer CH 3 I and cluster
(CH 3 I) 2 species. Open circles
show the amplitudes of each
of the contributions; solid
lines show the fitted curves
(Color figure online)
was employed for this purpose, where only two CH 3 groups are considered. The
energy of the Rydberg 3p z state was calculated as a function of the distance between the two CH 3 groups. A potential energy curve was obtained that shows significant distortion for elongated distances. This necessarily implies that the optical
window for the REMPI transition employed to detect the appearance of the CH 3
fragment will not be open until the distance is sufficiently long so that this distortion is negligible (at least, of the order of the bandwidth of the probe laser).
A classical 1D dynamic calculation was performed under the simplification that the
CH 3 dynamics takes place on the 3 Q 0 monomer surface (shifted by 0.12 eV to
account for the blue shift of the band), but the probe laser absorption could only
take place once the 3p z ( 2 A
2 ← 2 A
2 )0 0
0 transition in CH 3 became resonant under
the influence of the nearby presence of the other CH 3 . For the estimation of the
CH 3 –CH 3 distances, an axial CH 3 –I recoil and a head-tail geometry for the cluster were assumed. This calculation produced a delay of ∼ 80 fs for the I ∗ ( 2 P 1/2 )
channel with respect to the situation where distortion of the Rydberg state of CH 3