

3.7 Vibrational Structure of Electronic Spectra
97
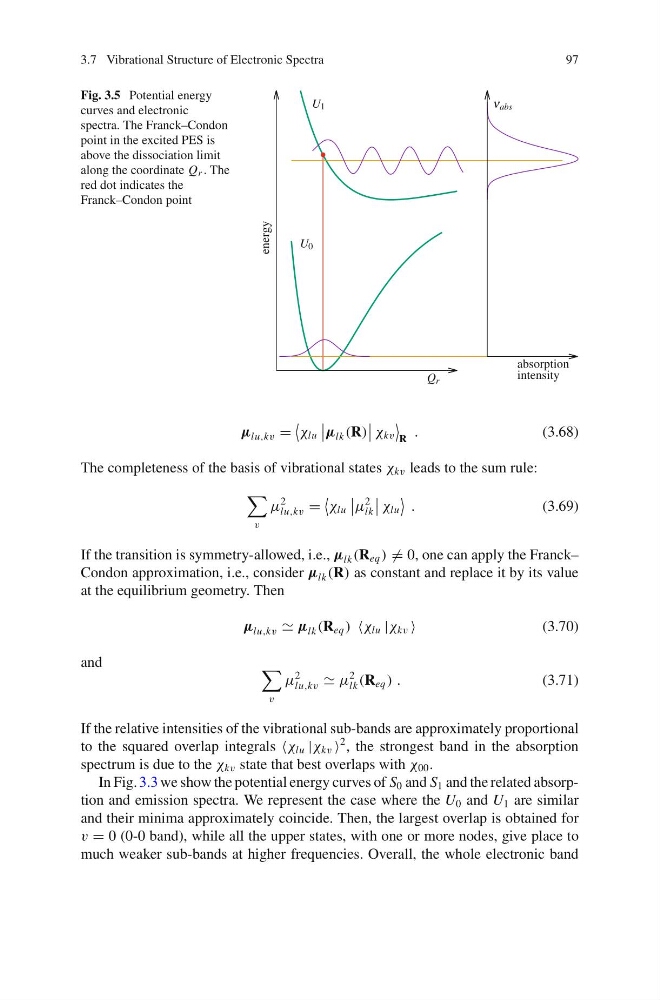
Fig. 3.5 Potential energy
curves and electronic
spectra. The Franck–Condon
point in the excited PES is
above the dissociation limit
along the coordinate Q r . The
red dot indicates the
Franck–Condon point
energy
•
abs
intensity
absorption
Q r
U 0
U 1
µ lu,kv =
χ lu
µ lk (R)
χ kv
R
.
(3.68)
The completeness of the basis of vibrational states χ kv leads to the sum rule:
v
μ
2
lu,kv =
χ lu
μ
2
lk
χ lu
.
(3.69)
If the transition is symmetry-allowed, i.e., µ lk (R eq ) = 0, one can apply the Franck–
Condon approximation, i.e., consider µ lk (R) as constant and replace it by its value
at the equilibrium geometry. Then
µ lu,kv µ lk (R eq ) χ lu |χ kv
(3.70)
and
v
μ
2
lu,kv μ
2
lk (R eq ) .
(3.71)
If the relative intensities of the vibrational sub-bands are approximately proportional
to the squared overlap integrals χ lu |χ kv
2 , the strongest band in the absorption
spectrum is due to the χ kv state that best overlaps with χ 00 .
In Fig. 3.3 we show the potential energy curves of S 0 and S 1 and the related absorption and emission spectra. We represent the case where the U 0 and U 1 are similar
and their minima approximately coincide. Then, the largest overlap is obtained for
v = 0 (0-0 band), while all the upper states, with one or more nodes, give place to
much weaker sub-bands at higher frequencies. Overall, the whole electronic band
97
Fig. 3.5 Potential energy
curves and electronic
spectra. The Franck–Condon
point in the excited PES is
above the dissociation limit
along the coordinate Q r . The
red dot indicates the
Franck–Condon point
energy
•
abs
intensity
absorption
Q r
U 0
U 1
µ lu,kv =
χ lu
µ lk (R)
χ kv
R
.
(3.68)
The completeness of the basis of vibrational states χ kv leads to the sum rule:
v
μ
2
lu,kv =
χ lu
μ
2
lk
χ lu
.
(3.69)
If the transition is symmetry-allowed, i.e., µ lk (R eq ) = 0, one can apply the Franck–
Condon approximation, i.e., consider µ lk (R) as constant and replace it by its value
at the equilibrium geometry. Then
µ lu,kv µ lk (R eq ) χ lu |χ kv
(3.70)
and
v
μ
2
lu,kv μ
2
lk (R eq ) .
(3.71)
If the relative intensities of the vibrational sub-bands are approximately proportional
to the squared overlap integrals χ lu |χ kv
2 , the strongest band in the absorption
spectrum is due to the χ kv state that best overlaps with χ 00 .
In Fig. 3.3 we show the potential energy curves of S 0 and S 1 and the related absorption and emission spectra. We represent the case where the U 0 and U 1 are similar
and their minima approximately coincide. Then, the largest overlap is obtained for
v = 0 (0-0 band), while all the upper states, with one or more nodes, give place to
much weaker sub-bands at higher frequencies. Overall, the whole electronic band