

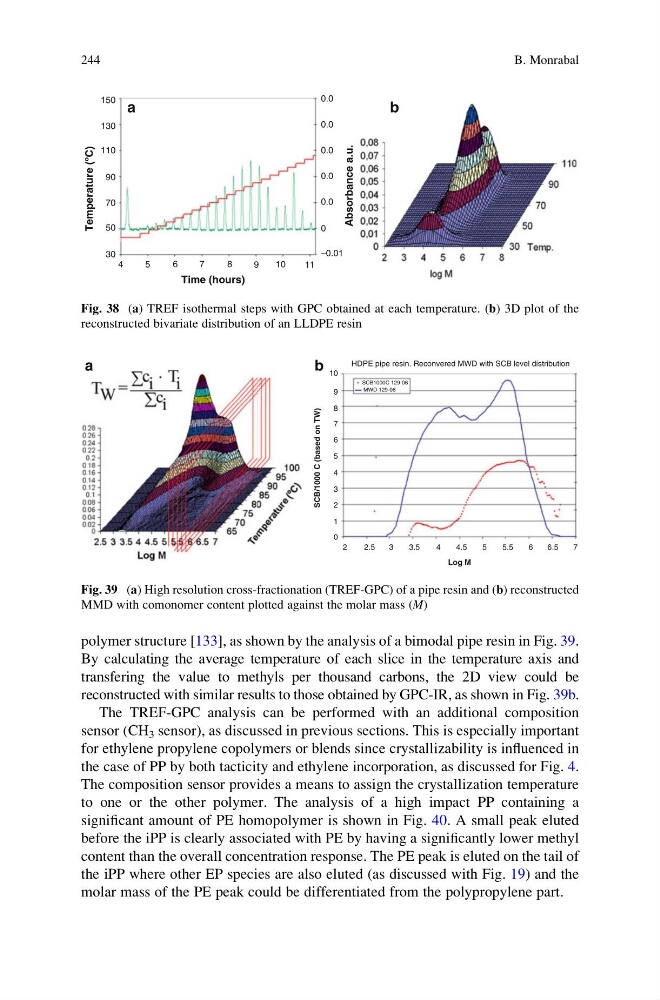
polymer structure [133], as shown by the analysis of a bimodal pipe resin in Fig. 39.
By calculating the average temperature of each slice in the temperature axis and
transfering the value to methyls per thousand carbons, the 2D view could be
reconstructed with similar results to those obtained by GPC-IR, as shown in Fig. 39b.
The TREF-GPC analysis can be performed with an additional composition
sensor (CH 3 sensor), as discussed in previous sections. This is especially important
for ethylene propylene copolymers or blends since crystallizability is influenced in
the case of PP by both tacticity and ethylene incorporation, as discussed for Fig. 4.
The composition sensor provides a means to assign the crystallization temperature
to one or the other polymer. The analysis of a high impact PP containing a
significant amount of PE homopolymer is shown in Fig. 40. A small peak eluted
before the iPP is clearly associated with PE by having a significantly lower methyl
content than the overall concentration response. The PE peak is eluted on the tail of
the iPP where other EP species are also eluted (as discussed with Fig. 19) and the
molar mass of the PE peak could be differentiated from the polypropylene part.
5
8
Time (hours)
9
11
0
Absorbance a.u.
0.0
0.0
0.0
0.0
0.0
–0.01
10
7
6
4
90
130
150
110
70
Temperature (ºC)
50
30
a
b
Fig. 38 (a) TREF isothermal steps with GPC obtained at each temperature. (b) 3D plot of the
reconstructed bivariate distribution of an LLDPE resin
2
1
0
SCB/1000 C (based on TW)
2
3
4
6
7
8
9
HDPE pipe resin. Reconvered MWD with SCB level distribution
10
5
2.5
3.5
6
6.5
7
5.5
5
Log M
4.5
4
3
SCB1000C 129-06
MWD 129-06
a
b
Fig. 39 (a) High resolution cross-fractionation (TREF-GPC) of a pipe resin and (b) reconstructed
MMD with comonomer content plotted against the molar mass (M)
244
B. Monrabal
By calculating the average temperature of each slice in the temperature axis and
transfering the value to methyls per thousand carbons, the 2D view could be
reconstructed with similar results to those obtained by GPC-IR, as shown in Fig. 39b.
The TREF-GPC analysis can be performed with an additional composition
sensor (CH 3 sensor), as discussed in previous sections. This is especially important
for ethylene propylene copolymers or blends since crystallizability is influenced in
the case of PP by both tacticity and ethylene incorporation, as discussed for Fig. 4.
The composition sensor provides a means to assign the crystallization temperature
to one or the other polymer. The analysis of a high impact PP containing a
significant amount of PE homopolymer is shown in Fig. 40. A small peak eluted
before the iPP is clearly associated with PE by having a significantly lower methyl
content than the overall concentration response. The PE peak is eluted on the tail of
the iPP where other EP species are also eluted (as discussed with Fig. 19) and the
molar mass of the PE peak could be differentiated from the polypropylene part.
5
8
Time (hours)
9
11
0
Absorbance a.u.
0.0
0.0
0.0
0.0
0.0
–0.01
10
7
6
4
90
130
150
110
70
Temperature (ºC)
50
30
a
b
Fig. 38 (a) TREF isothermal steps with GPC obtained at each temperature. (b) 3D plot of the
reconstructed bivariate distribution of an LLDPE resin
2
1
0
SCB/1000 C (based on TW)
2
3
4
6
7
8
9
HDPE pipe resin. Reconvered MWD with SCB level distribution
10
5
2.5
3.5
6
6.5
7
5.5
5
Log M
4.5
4
3
SCB1000C 129-06
MWD 129-06
a
b
Fig. 39 (a) High resolution cross-fractionation (TREF-GPC) of a pipe resin and (b) reconstructed
MMD with comonomer content plotted against the molar mass (M)
244
B. Monrabal