

82
L. Fang and S. Li
Table 4.1 Mean and standard deviation of the MSR and CNR results for seventeen SDOCT retinal
images using the Tikhonov [15], New SURE [39], K-SVD [28], BM3D [40] and the proposed
MSBTD method
Original
Tikhonov
[15]
New SURE
[39]
K-SVD
[28]
BM3D [40] MSBTD
Mean
(CNR )
1.27
3.13
2.49
4.11
3.89
4.76
Standard
deviation
(CNR)
0.43
0.94
0.60
1.23
1.05
1.54
Mean
(MSR)
3.20
7.62
6.74
11.22
11.52
14.76
Standard
deviation
(MSR)
0.46
0.95
1.69
2.77
2.42
4.75
The best results in the table are labeled in bold
Table 4.2 Mean and standard deviation of the PSNR (dB) for seventeen SDOCT foveal images
obtained from the Tikhonov [15], New SURE [39], K-SVD [28], BM3D [40], and the proposed
MSBTD method
Tikhonov [15] New SURE
[39]
K-SVD [28]
BM3D [40]
MSBTD
Mean (PSNR) 23.67
23.46
26.13
26.04
26.46
Standard
deviation
(PSNR)
0.96
1.40
1.70
1.65
1.72
The best result the table is labeled in bold
[44], three boundary regions (boxes #2, 3, 4) in these images are marked with red
rectangle and magnified. As can be seen, the Tikhonov and New SURE methods
show limited noise suppression for the test images. Though the K-SVD method can
better remove the noise, it introduces over-smoothing, thus leading to significant loss
of image details. The BM3D method can achieve improved noise suppression and
limit the over-smoothing problem to some extent, but creating obvious artifacts. By
contrast, application of the proposed MSBTD method results in noticeably improved
noise suppression, while preserving details compared to other methods. Especially,
note in the layer boundary preservation in the area magnified by the red boxes (e.g.
#2 and #4).
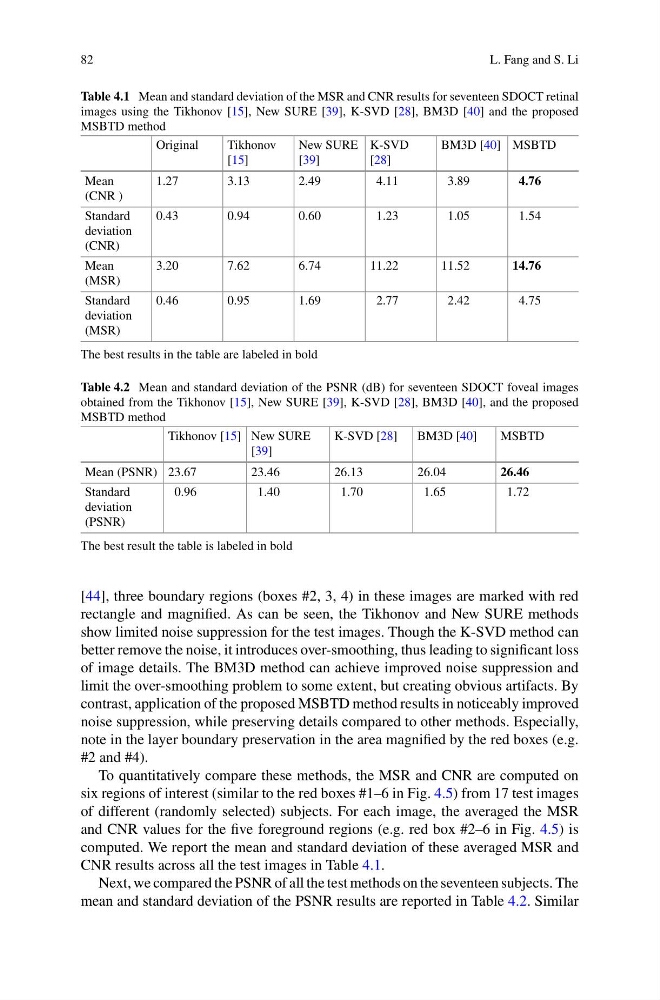
To quantitatively compare these methods, the MSR and CNR are computed on
six regions of interest (similar to the red boxes #1–6 in Fig. 4.5) from 17 test images
of different (randomly selected) subjects. For each image, the averaged the MSR
and CNR values for the five foreground regions (e.g. red box #2–6 in Fig. 4.5) is
computed. We report the mean and standard deviation of these averaged MSR and
CNR results across all the test images in Table 4.1.
Next, we compared the PSNR of all the test methods on the seventeen subjects. The
mean and standard deviation of the PSNR results are reported in Table 4.2. Similar
L. Fang and S. Li
Table 4.1 Mean and standard deviation of the MSR and CNR results for seventeen SDOCT retinal
images using the Tikhonov [15], New SURE [39], K-SVD [28], BM3D [40] and the proposed
MSBTD method
Original
Tikhonov
[15]
New SURE
[39]
K-SVD
[28]
BM3D [40] MSBTD
Mean
(CNR )
1.27
3.13
2.49
4.11
3.89
4.76
Standard
deviation
(CNR)
0.43
0.94
0.60
1.23
1.05
1.54
Mean
(MSR)
3.20
7.62
6.74
11.22
11.52
14.76
Standard
deviation
(MSR)
0.46
0.95
1.69
2.77
2.42
4.75
The best results in the table are labeled in bold
Table 4.2 Mean and standard deviation of the PSNR (dB) for seventeen SDOCT foveal images
obtained from the Tikhonov [15], New SURE [39], K-SVD [28], BM3D [40], and the proposed
MSBTD method
Tikhonov [15] New SURE
[39]
K-SVD [28]
BM3D [40]
MSBTD
Mean (PSNR) 23.67
23.46
26.13
26.04
26.46
Standard
deviation
(PSNR)
0.96
1.40
1.70
1.65
1.72
The best result the table is labeled in bold
[44], three boundary regions (boxes #2, 3, 4) in these images are marked with red
rectangle and magnified. As can be seen, the Tikhonov and New SURE methods
show limited noise suppression for the test images. Though the K-SVD method can
better remove the noise, it introduces over-smoothing, thus leading to significant loss
of image details. The BM3D method can achieve improved noise suppression and
limit the over-smoothing problem to some extent, but creating obvious artifacts. By
contrast, application of the proposed MSBTD method results in noticeably improved
noise suppression, while preserving details compared to other methods. Especially,
note in the layer boundary preservation in the area magnified by the red boxes (e.g.
#2 and #4).
To quantitatively compare these methods, the MSR and CNR are computed on
six regions of interest (similar to the red boxes #1–6 in Fig. 4.5) from 17 test images
of different (randomly selected) subjects. For each image, the averaged the MSR
and CNR values for the five foreground regions (e.g. red box #2–6 in Fig. 4.5) is
computed. We report the mean and standard deviation of these averaged MSR and
CNR results across all the test images in Table 4.1.
Next, we compared the PSNR of all the test methods on the seventeen subjects. The
mean and standard deviation of the PSNR results are reported in Table 4.2. Similar