

13 Modeling and Prediction of Choroidal Neovascularization …
377
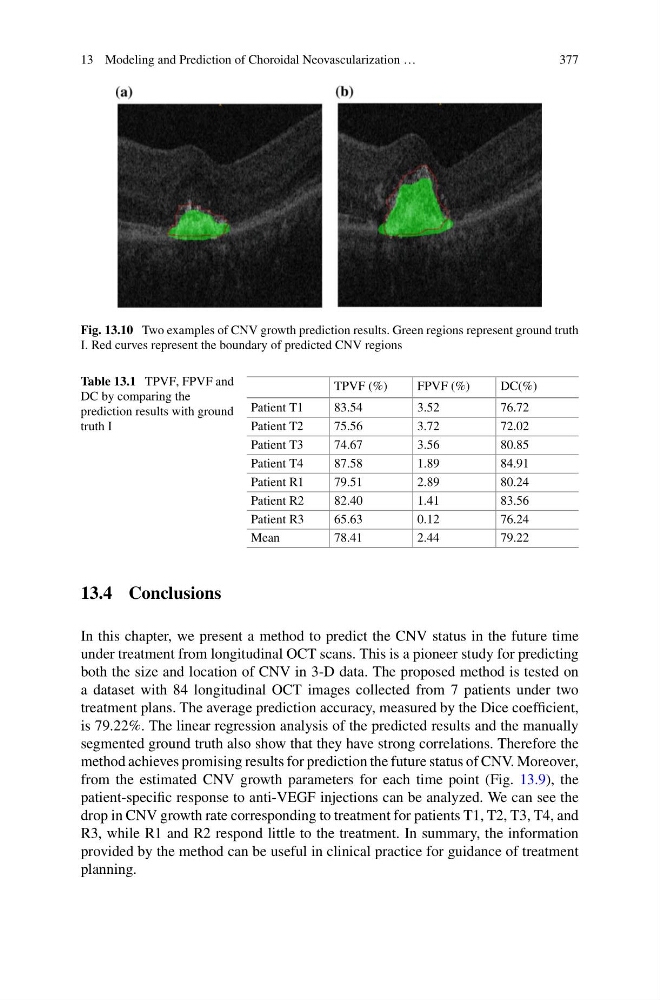
Fig. 13.10 Two examples of CNV growth prediction results. Green regions represent ground truth
I. Red curves represent the boundary of predicted CNV regions
Table 13.1 TPVF, FPVF and
DC by comparing the
prediction results with ground
truth I
TPVF (%)
FPVF (%)
DC(%)
Patient T1
83.54
3.52
76.72
Patient T2
75.56
3.72
72.02
Patient T3
74.67
3.56
80.85
Patient T4
87.58
1.89
84.91
Patient R1
79.51
2.89
80.24
Patient R2
82.40
1.41
83.56
Patient R3
65.63
0.12
76.24
Mean
78.41
2.44
79.22
13.4 Conclusions
In this chapter, we present a method to predict the CNV status in the future time
under treatment from longitudinal OCT scans. This is a pioneer study for predicting
both the size and location of CNV in 3-D data. The proposed method is tested on
a dataset with 84 longitudinal OCT images collected from 7 patients under two
treatment plans. The average prediction accuracy, measured by the Dice coefficient,
is 79.22%. The linear regression analysis of the predicted results and the manually
segmented ground truth also show that they have strong correlations. Therefore the
method achieves promising results for prediction the future status of CNV. Moreover,
from the estimated CNV growth parameters for each time point (Fig. 13.9), the
patient-specific response to anti-VEGF injections can be analyzed. We can see the
drop in CNV growth rate corresponding to treatment for patients T1, T2, T3, T4, and
R3, while R1 and R2 respond little to the treatment. In summary, the information
provided by the method can be useful in clinical practice for guidance of treatment
planning.
377
Fig. 13.10 Two examples of CNV growth prediction results. Green regions represent ground truth
I. Red curves represent the boundary of predicted CNV regions
Table 13.1 TPVF, FPVF and
DC by comparing the
prediction results with ground
truth I
TPVF (%)
FPVF (%)
DC(%)
Patient T1
83.54
3.52
76.72
Patient T2
75.56
3.72
72.02
Patient T3
74.67
3.56
80.85
Patient T4
87.58
1.89
84.91
Patient R1
79.51
2.89
80.24
Patient R2
82.40
1.41
83.56
Patient R3
65.63
0.12
76.24
Mean
78.41
2.44
79.22
13.4 Conclusions
In this chapter, we present a method to predict the CNV status in the future time
under treatment from longitudinal OCT scans. This is a pioneer study for predicting
both the size and location of CNV in 3-D data. The proposed method is tested on
a dataset with 84 longitudinal OCT images collected from 7 patients under two
treatment plans. The average prediction accuracy, measured by the Dice coefficient,
is 79.22%. The linear regression analysis of the predicted results and the manually
segmented ground truth also show that they have strong correlations. Therefore the
method achieves promising results for prediction the future status of CNV. Moreover,
from the estimated CNV growth parameters for each time point (Fig. 13.9), the
patient-specific response to anti-VEGF injections can be analyzed. We can see the
drop in CNV growth rate corresponding to treatment for patients T1, T2, T3, T4, and
R3, while R1 and R2 respond little to the treatment. In summary, the information
provided by the method can be useful in clinical practice for guidance of treatment
planning.