

368
F. Shi et al.
quite different [2]. Ideally, a patient-specific treatment plan with minimally necessary
number of anti-VEGF injections is required.
First proposed in 1991 by Huang et al. [3], optical coherence tomography (OCT)
is a non-invasive imaging technique which provides 3D cross-sectional images of
biological tissues with a high resolution. Based on the retinal OCT images, the
size, position and shape of lesion area, including cystoid edema, intraretinal and
subretinal fluid, and CNV, can be quantified, and tracking can be achieved from
longitudinal OCT scans [4–6]. Therefore OCT has become the most effective tool
for monitoring the condition of CNV. In PrONTO trial [7], also known as prospective
optical coherence tomography imaging of patients with neovascular AMD treated
with intra-ocular ranibizumab, OCT was used to help design the treatment plans
for CNV. All patients were given three intravitreal injections at 4 weeks interval
during an induction phase. After that, a variable dosing regimen was used, where
patients received injections when specific criteria were met. These criteria included
intraretinal or subretinal fluid viewed in OCT images and central retinal thickness
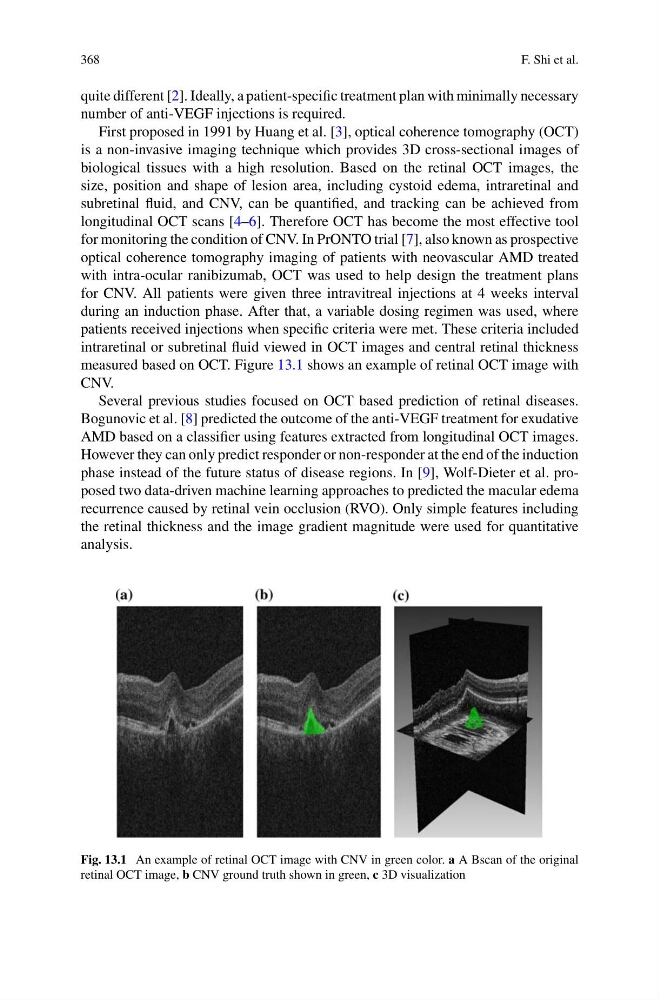
measured based on OCT. Figure 13.1 shows an example of retinal OCT image with
CNV.
Several previous studies focused on OCT based prediction of retinal diseases.
Bogunovic et al. [8] predicted the outcome of the anti-VEGF treatment for exudative
AMD based on a classifier using features extracted from longitudinal OCT images.
However they can only predict responder or non-responder at the end of the induction
phase instead of the future status of disease regions. In [9], Wolf-Dieter et al. proposed two data-driven machine learning approaches to predicted the macular edema
recurrence caused by retinal vein occlusion (RVO). Only simple features including
the retinal thickness and the image gradient magnitude were used for quantitative
analysis.
Fig. 13.1 An example of retinal OCT image with CNV in green color. a A Bscan of the original
retinal OCT image, b CNV ground truth shown in green, c 3D visualization
F. Shi et al.
quite different [2]. Ideally, a patient-specific treatment plan with minimally necessary
number of anti-VEGF injections is required.
First proposed in 1991 by Huang et al. [3], optical coherence tomography (OCT)
is a non-invasive imaging technique which provides 3D cross-sectional images of
biological tissues with a high resolution. Based on the retinal OCT images, the
size, position and shape of lesion area, including cystoid edema, intraretinal and
subretinal fluid, and CNV, can be quantified, and tracking can be achieved from
longitudinal OCT scans [4–6]. Therefore OCT has become the most effective tool
for monitoring the condition of CNV. In PrONTO trial [7], also known as prospective
optical coherence tomography imaging of patients with neovascular AMD treated
with intra-ocular ranibizumab, OCT was used to help design the treatment plans
for CNV. All patients were given three intravitreal injections at 4 weeks interval
during an induction phase. After that, a variable dosing regimen was used, where
patients received injections when specific criteria were met. These criteria included
intraretinal or subretinal fluid viewed in OCT images and central retinal thickness
measured based on OCT. Figure 13.1 shows an example of retinal OCT image with
CNV.
Several previous studies focused on OCT based prediction of retinal diseases.
Bogunovic et al. [8] predicted the outcome of the anti-VEGF treatment for exudative
AMD based on a classifier using features extracted from longitudinal OCT images.
However they can only predict responder or non-responder at the end of the induction
phase instead of the future status of disease regions. In [9], Wolf-Dieter et al. proposed two data-driven machine learning approaches to predicted the macular edema
recurrence caused by retinal vein occlusion (RVO). Only simple features including
the retinal thickness and the image gradient magnitude were used for quantitative
analysis.
Fig. 13.1 An example of retinal OCT image with CNV in green color. a A Bscan of the original
retinal OCT image, b CNV ground truth shown in green, c 3D visualization