

346
L. Pan and X. Chen
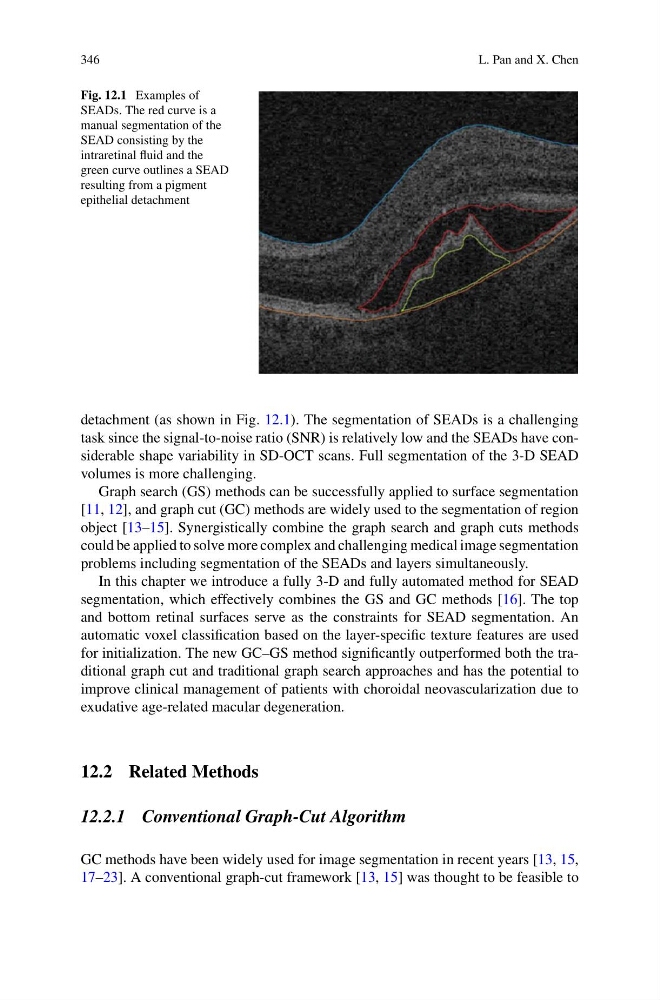
Fig. 12.1 Examples of
SEADs. The red curve is a
manual segmentation of the
SEAD consisting by the
intraretinal fluid and the
green curve outlines a SEAD
resulting from a pigment
epithelial detachment
detachment (as shown in Fig. 12.1). The segmentation of SEADs is a challenging
task since the signal-to-noise ratio (SNR) is relatively low and the SEADs have considerable shape variability in SD-OCT scans. Full segmentation of the 3-D SEAD
volumes is more challenging.
Graph search (GS) methods can be successfully applied to surface segmentation
[11, 12], and graph cut (GC) methods are widely used to the segmentation of region
object [13–15]. Synergistically combine the graph search and graph cuts methods
could be applied to solve more complex and challenging medical image segmentation
problems including segmentation of the SEADs and layers simultaneously.
In this chapter we introduce a fully 3-D and fully automated method for SEAD
segmentation, which effectively combines the GS and GC methods [16]. The top
and bottom retinal surfaces serve as the constraints for SEAD segmentation. An
automatic voxel classification based on the layer-specific texture features are used
for initialization. The new GC–GS method significantly outperformed both the traditional graph cut and traditional graph search approaches and has the potential to
improve clinical management of patients with choroidal neovascularization due to
exudative age-related macular degeneration.
12.2 Related Methods
12.2.1 Conventional Graph-Cut Algorithm
GC methods have been widely used for image segmentation in recent years [13, 15,
17–23]. A conventional graph-cut framework [13, 15] was thought to be feasible to
L. Pan and X. Chen
Fig. 12.1 Examples of
SEADs. The red curve is a
manual segmentation of the
SEAD consisting by the
intraretinal fluid and the
green curve outlines a SEAD
resulting from a pigment
epithelial detachment
detachment (as shown in Fig. 12.1). The segmentation of SEADs is a challenging
task since the signal-to-noise ratio (SNR) is relatively low and the SEADs have considerable shape variability in SD-OCT scans. Full segmentation of the 3-D SEAD
volumes is more challenging.
Graph search (GS) methods can be successfully applied to surface segmentation
[11, 12], and graph cut (GC) methods are widely used to the segmentation of region
object [13–15]. Synergistically combine the graph search and graph cuts methods
could be applied to solve more complex and challenging medical image segmentation
problems including segmentation of the SEADs and layers simultaneously.
In this chapter we introduce a fully 3-D and fully automated method for SEAD
segmentation, which effectively combines the GS and GC methods [16]. The top
and bottom retinal surfaces serve as the constraints for SEAD segmentation. An
automatic voxel classification based on the layer-specific texture features are used
for initialization. The new GC–GS method significantly outperformed both the traditional graph cut and traditional graph search approaches and has the potential to
improve clinical management of patients with choroidal neovascularization due to
exudative age-related macular degeneration.
12.2 Related Methods
12.2.1 Conventional Graph-Cut Algorithm
GC methods have been widely used for image segmentation in recent years [13, 15,
17–23]. A conventional graph-cut framework [13, 15] was thought to be feasible to