

11 Segmentation and Visualization of Drusen …
331
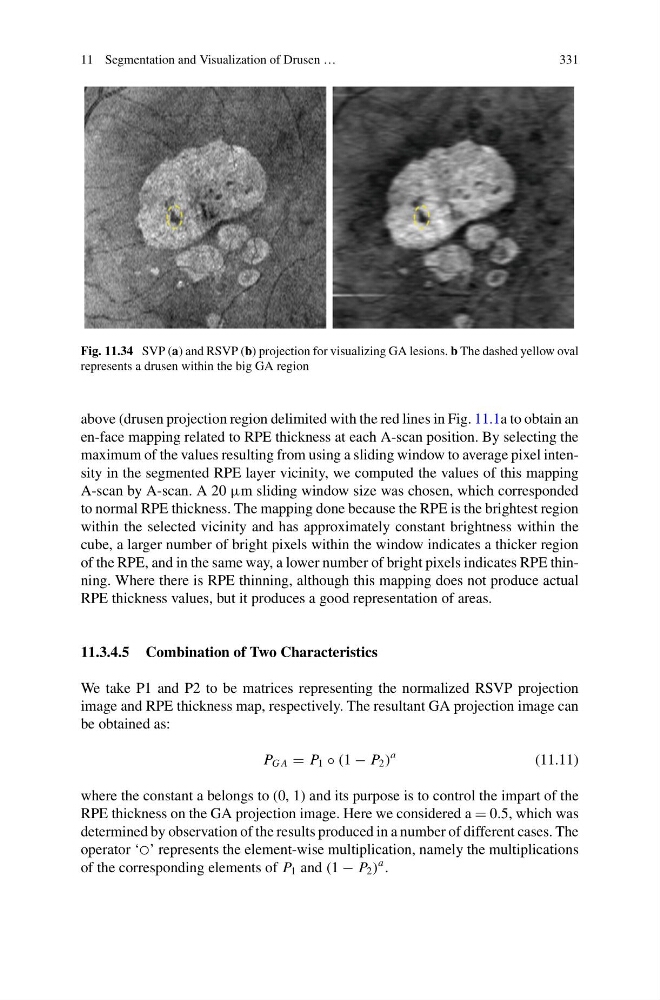
Fig. 11.34 SVP (a) and RSVP (b) projection for visualizing GA lesions. b The dashed yellow oval
represents a drusen within the big GA region
above (drusen projection region delimited with the red lines in Fig. 11.1a to obtain an
en-face mapping related to RPE thickness at each A-scan position. By selecting the
maximum of the values resulting from using a sliding window to average pixel intensity in the segmented RPE layer vicinity, we computed the values of this mapping
A-scan by A-scan. A 20 µm sliding window size was chosen, which corresponded
to normal RPE thickness. The mapping done because the RPE is the brightest region
within the selected vicinity and has approximately constant brightness within the
cube, a larger number of bright pixels within the window indicates a thicker region
of the RPE, and in the same way, a lower number of bright pixels indicates RPE thinning. Where there is RPE thinning, although this mapping does not produce actual
RPE thickness values, but it produces a good representation of areas.
11.3.4.5 Combination of Two Characteristics
We take P1 and P2 to be matrices representing the normalized RSVP projection
image and RPE thickness map, respectively. The resultant GA projection image can
be obtained as:
P G A P 1 ◦ (1 − P 2 )
a
(11.11)
where the constant a belongs to (0, 1) and its purpose is to control the impart of the
RPE thickness on the GA projection image. Here we considered a 0.5, which was
determined by observation of the results produced in a number of different cases. The
operator ‘◯’ represents the element-wise multiplication, namely the multiplications
of the corresponding elements of P 1 and (1 − P 2 )
a .
331
Fig. 11.34 SVP (a) and RSVP (b) projection for visualizing GA lesions. b The dashed yellow oval
represents a drusen within the big GA region
above (drusen projection region delimited with the red lines in Fig. 11.1a to obtain an
en-face mapping related to RPE thickness at each A-scan position. By selecting the
maximum of the values resulting from using a sliding window to average pixel intensity in the segmented RPE layer vicinity, we computed the values of this mapping
A-scan by A-scan. A 20 µm sliding window size was chosen, which corresponded
to normal RPE thickness. The mapping done because the RPE is the brightest region
within the selected vicinity and has approximately constant brightness within the
cube, a larger number of bright pixels within the window indicates a thicker region
of the RPE, and in the same way, a lower number of bright pixels indicates RPE thinning. Where there is RPE thinning, although this mapping does not produce actual
RPE thickness values, but it produces a good representation of areas.
11.3.4.5 Combination of Two Characteristics
We take P1 and P2 to be matrices representing the normalized RSVP projection
image and RPE thickness map, respectively. The resultant GA projection image can
be obtained as:
P G A P 1 ◦ (1 − P 2 )
a
(11.11)
where the constant a belongs to (0, 1) and its purpose is to control the impart of the
RPE thickness on the GA projection image. Here we considered a 0.5, which was
determined by observation of the results produced in a number of different cases. The
operator ‘◯’ represents the element-wise multiplication, namely the multiplications
of the corresponding elements of P 1 and (1 − P 2 )
a .