

11 Segmentation and Visualization of Drusen …
321
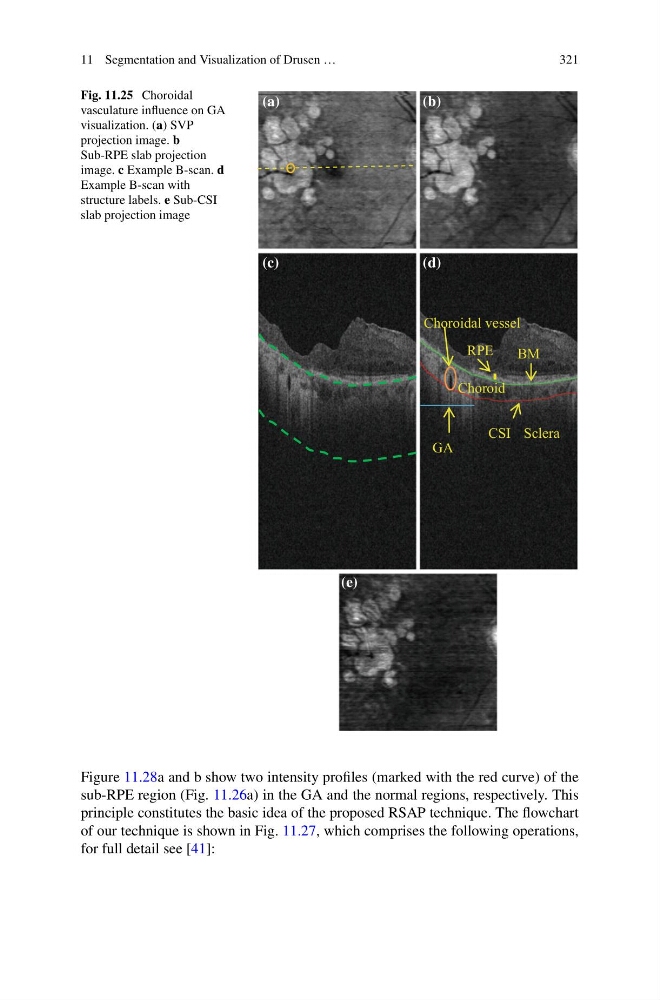
Fig. 11.25 Choroidal
vasculature influence on GA
visualization. (a) SVP
projection image. b
Sub-RPE slab projection
image. c Example B-scan. d
Example B-scan with
structure labels. e Sub-CSI
slab projection image
BM
CSI
Choroid
Sclera
RPE
Choroidal vessel
GA
(a)
(b)
(d)
(c)
(e)
Figure 11.28a and b show two intensity profiles (marked with the red curve) of the
sub-RPE region (Fig. 11.26a) in the GA and the normal regions, respectively. This
principle constitutes the basic idea of the proposed RSAP technique. The flowchart
of our technique is shown in Fig. 11.27, which comprises the following operations,
for full detail see [41]:
321
Fig. 11.25 Choroidal
vasculature influence on GA
visualization. (a) SVP
projection image. b
Sub-RPE slab projection
image. c Example B-scan. d
Example B-scan with
structure labels. e Sub-CSI
slab projection image
BM
CSI
Choroid
Sclera
RPE
Choroidal vessel
GA
(a)
(b)
(d)
(c)
(e)
Figure 11.28a and b show two intensity profiles (marked with the red curve) of the
sub-RPE region (Fig. 11.26a) in the GA and the normal regions, respectively. This
principle constitutes the basic idea of the proposed RSAP technique. The flowchart
of our technique is shown in Fig. 11.27, which comprises the following operations,
for full detail see [41]: