

11 Segmentation and Visualization of Drusen …
309
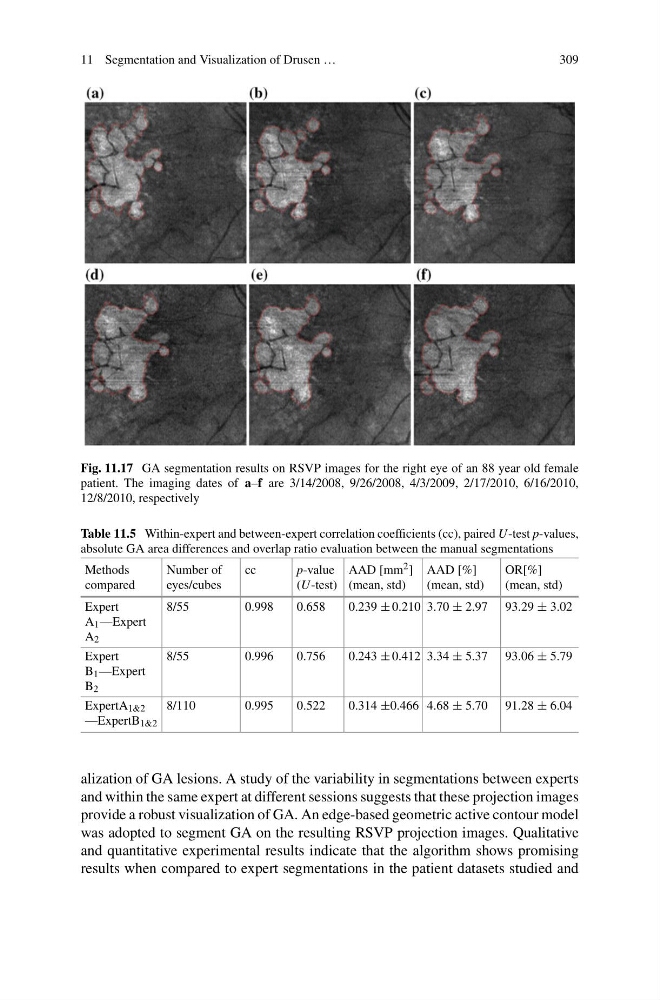
Fig. 11.17 GA segmentation results on RSVP images for the right eye of an 88 year old female
patient. The imaging dates of a–f are 3/14/2008, 9/26/2008, 4/3/2009, 2/17/2010, 6/16/2010,
12/8/2010, respectively
Table 11.5 Within-expert and between-expert correlation coefficients (cc), paired U-test p-values,
absolute GA area differences and overlap ratio evaluation between the manual segmentations
Methods
compared
Number of
eyes/cubes
cc
p-value
(U-test)
AAD [mm 2 ]
(mean, std)
AAD [%]
(mean, std)
OR[%]
(mean, std)
Expert
A 1 —Expert
A 2
8/55
0.998
0.658
0.239 ± 0.210 3.70 ± 2.97 93.29 ± 3.02
Expert
B 1 —Expert
B 2
8/55
0.996
0.756
0.243 ± 0.412 3.34 ± 5.37 93.06 ± 5.79
ExpertA 1&2
—ExpertB 1&2
8/110
0.995
0.522
0.314 ±0.466 4.68 ± 5.70 91.28 ± 6.04
alization of GA lesions. A study of the variability in segmentations between experts
and within the same expert at different sessions suggests that these projection images
provide a robust visualization of GA. An edge-based geometric active contour model
was adopted to segment GA on the resulting RSVP projection images. Qualitative
and quantitative experimental results indicate that the algorithm shows promising
results when compared to expert segmentations in the patient datasets studied and
309
Fig. 11.17 GA segmentation results on RSVP images for the right eye of an 88 year old female
patient. The imaging dates of a–f are 3/14/2008, 9/26/2008, 4/3/2009, 2/17/2010, 6/16/2010,
12/8/2010, respectively
Table 11.5 Within-expert and between-expert correlation coefficients (cc), paired U-test p-values,
absolute GA area differences and overlap ratio evaluation between the manual segmentations
Methods
compared
Number of
eyes/cubes
cc
p-value
(U-test)
AAD [mm 2 ]
(mean, std)
AAD [%]
(mean, std)
OR[%]
(mean, std)
Expert
A 1 —Expert
A 2
8/55
0.998
0.658
0.239 ± 0.210 3.70 ± 2.97 93.29 ± 3.02
Expert
B 1 —Expert
B 2
8/55
0.996
0.756
0.243 ± 0.412 3.34 ± 5.37 93.06 ± 5.79
ExpertA 1&2
—ExpertB 1&2
8/110
0.995
0.522
0.314 ±0.466 4.68 ± 5.70 91.28 ± 6.04
alization of GA lesions. A study of the variability in segmentations between experts
and within the same expert at different sessions suggests that these projection images
provide a robust visualization of GA. An edge-based geometric active contour model
was adopted to segment GA on the resulting RSVP projection images. Qualitative
and quantitative experimental results indicate that the algorithm shows promising
results when compared to expert segmentations in the patient datasets studied and