

11 Segmentation and Visualization of Drusen …
299
number of drusen in the gold standard-marked image. This metric calculated the
accuracy of each technique in identifying drusen present in the cube: if most of the
drusen outlined in the gold standard marked images could also be visualized in the
en face image, the overlap ratio would be closer to 1. However, as more drusen are
“missed” in the en face images, this overlap ratio approached 0.
11.2.2.5 Results
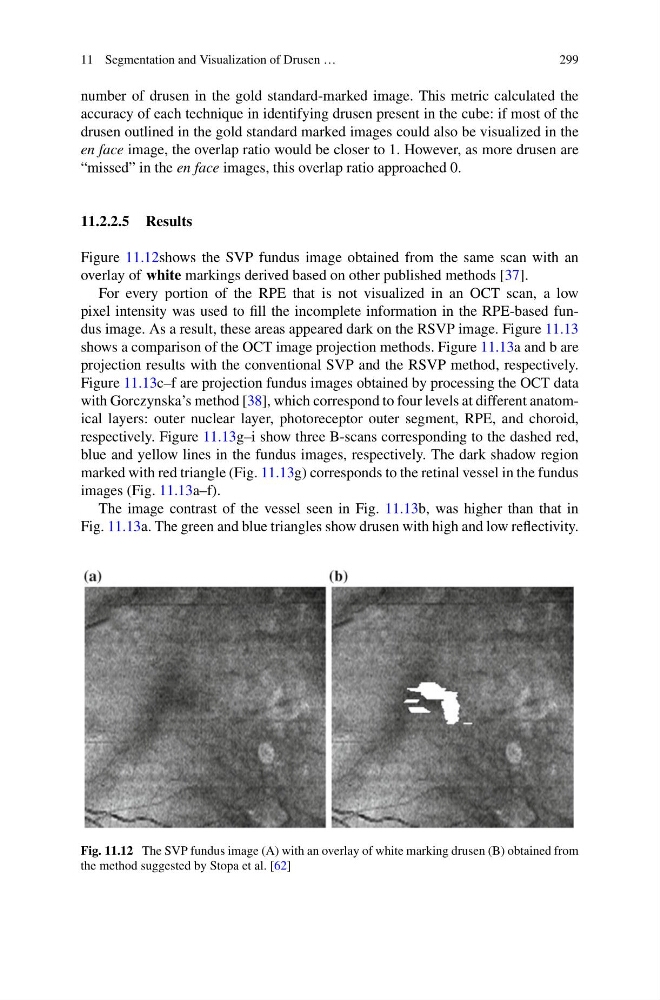
Figure 11.12shows the SVP fundus image obtained from the same scan with an
overlay of white markings derived based on other published methods [37].
For every portion of the RPE that is not visualized in an OCT scan, a low
pixel intensity was used to fill the incomplete information in the RPE-based fundus image. As a result, these areas appeared dark on the RSVP image. Figure 11.13
shows a comparison of the OCT image projection methods. Figure 11.13a and b are
projection results with the conventional SVP and the RSVP method, respectively.
Figure 11.13c–f are projection fundus images obtained by processing the OCT data
with Gorczynska’s method [38], which correspond to four levels at different anatomical layers: outer nuclear layer, photoreceptor outer segment, RPE, and choroid,
respectively. Figure 11.13g–i show three B-scans corresponding to the dashed red,
blue and yellow lines in the fundus images, respectively. The dark shadow region
marked with red triangle (Fig. 11.13g) corresponds to the retinal vessel in the fundus
images (Fig. 11.13a–f).
The image contrast of the vessel seen in Fig. 11.13b, was higher than that in
Fig. 11.13a. The green and blue triangles show drusen with high and low reflectivity.
Fig. 11.12 The SVP fundus image (A) with an overlay of white marking drusen (B) obtained from
the method suggested by Stopa et al. [62]
299
number of drusen in the gold standard-marked image. This metric calculated the
accuracy of each technique in identifying drusen present in the cube: if most of the
drusen outlined in the gold standard marked images could also be visualized in the
en face image, the overlap ratio would be closer to 1. However, as more drusen are
“missed” in the en face images, this overlap ratio approached 0.
11.2.2.5 Results
Figure 11.12shows the SVP fundus image obtained from the same scan with an
overlay of white markings derived based on other published methods [37].
For every portion of the RPE that is not visualized in an OCT scan, a low
pixel intensity was used to fill the incomplete information in the RPE-based fundus image. As a result, these areas appeared dark on the RSVP image. Figure 11.13
shows a comparison of the OCT image projection methods. Figure 11.13a and b are
projection results with the conventional SVP and the RSVP method, respectively.
Figure 11.13c–f are projection fundus images obtained by processing the OCT data
with Gorczynska’s method [38], which correspond to four levels at different anatomical layers: outer nuclear layer, photoreceptor outer segment, RPE, and choroid,
respectively. Figure 11.13g–i show three B-scans corresponding to the dashed red,
blue and yellow lines in the fundus images, respectively. The dark shadow region
marked with red triangle (Fig. 11.13g) corresponds to the retinal vessel in the fundus
images (Fig. 11.13a–f).
The image contrast of the vessel seen in Fig. 11.13b, was higher than that in
Fig. 11.13a. The green and blue triangles show drusen with high and low reflectivity.
Fig. 11.12 The SVP fundus image (A) with an overlay of white marking drusen (B) obtained from
the method suggested by Stopa et al. [62]