

11 Segmentation and Visualization of Drusen …
283
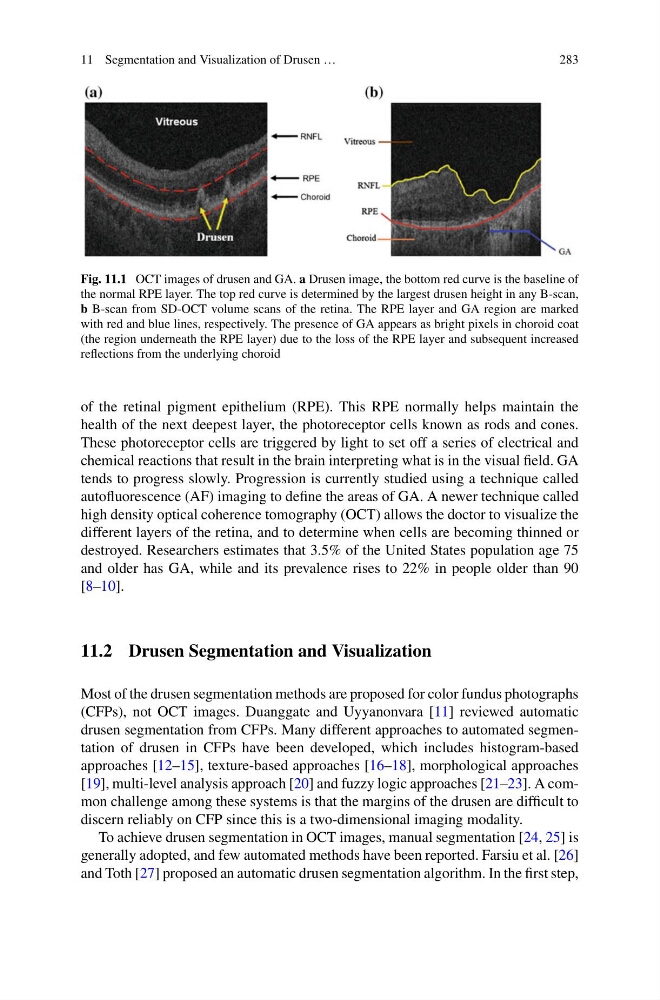
Fig. 11.1 OCT images of drusen and GA. a Drusen image, the bottom red curve is the baseline of
the normal RPE layer. The top red curve is determined by the largest drusen height in any B-scan,
b B-scan from SD-OCT volume scans of the retina. The RPE layer and GA region are marked
with red and blue lines, respectively. The presence of GA appears as bright pixels in choroid coat
(the region underneath the RPE layer) due to the loss of the RPE layer and subsequent increased
reflections from the underlying choroid
of the retinal pigment epithelium (RPE). This RPE normally helps maintain the
health of the next deepest layer, the photoreceptor cells known as rods and cones.
These photoreceptor cells are triggered by light to set off a series of electrical and
chemical reactions that result in the brain interpreting what is in the visual field. GA
tends to progress slowly. Progression is currently studied using a technique called
autofluorescence (AF) imaging to define the areas of GA. A newer technique called
high density optical coherence tomography (OCT) allows the doctor to visualize the
different layers of the retina, and to determine when cells are becoming thinned or
destroyed. Researchers estimates that 3.5% of the United States population age 75
and older has GA, while and its prevalence rises to 22% in people older than 90
[8–10].
11.2 Drusen Segmentation and Visualization
Most of the drusen segmentation methods are proposed for color fundus photographs
(CFPs), not OCT images. Duanggate and Uyyanonvara [11] reviewed automatic
drusen segmentation from CFPs. Many different approaches to automated segmentation of drusen in CFPs have been developed, which includes histogram-based
approaches [12–15], texture-based approaches [16–18], morphological approaches
[19], multi-level analysis approach [20] and fuzzy logic approaches [21–23]. A common challenge among these systems is that the margins of the drusen are difficult to
discern reliably on CFP since this is a two-dimensional imaging modality.
To achieve drusen segmentation in OCT images, manual segmentation [24, 25] is
generally adopted, and few automated methods have been reported. Farsiu et al. [26]
and Toth [27] proposed an automatic drusen segmentation algorithm. In the first step,
283
Fig. 11.1 OCT images of drusen and GA. a Drusen image, the bottom red curve is the baseline of
the normal RPE layer. The top red curve is determined by the largest drusen height in any B-scan,
b B-scan from SD-OCT volume scans of the retina. The RPE layer and GA region are marked
with red and blue lines, respectively. The presence of GA appears as bright pixels in choroid coat
(the region underneath the RPE layer) due to the loss of the RPE layer and subsequent increased
reflections from the underlying choroid
of the retinal pigment epithelium (RPE). This RPE normally helps maintain the
health of the next deepest layer, the photoreceptor cells known as rods and cones.
These photoreceptor cells are triggered by light to set off a series of electrical and
chemical reactions that result in the brain interpreting what is in the visual field. GA
tends to progress slowly. Progression is currently studied using a technique called
autofluorescence (AF) imaging to define the areas of GA. A newer technique called
high density optical coherence tomography (OCT) allows the doctor to visualize the
different layers of the retina, and to determine when cells are becoming thinned or
destroyed. Researchers estimates that 3.5% of the United States population age 75
and older has GA, while and its prevalence rises to 22% in people older than 90
[8–10].
11.2 Drusen Segmentation and Visualization
Most of the drusen segmentation methods are proposed for color fundus photographs
(CFPs), not OCT images. Duanggate and Uyyanonvara [11] reviewed automatic
drusen segmentation from CFPs. Many different approaches to automated segmentation of drusen in CFPs have been developed, which includes histogram-based
approaches [12–15], texture-based approaches [16–18], morphological approaches
[19], multi-level analysis approach [20] and fuzzy logic approaches [21–23]. A common challenge among these systems is that the margins of the drusen are difficult to
discern reliably on CFP since this is a two-dimensional imaging modality.
To achieve drusen segmentation in OCT images, manual segmentation [24, 25] is
generally adopted, and few automated methods have been reported. Farsiu et al. [26]
and Toth [27] proposed an automatic drusen segmentation algorithm. In the first step,