

10 Layer Segmentation and Analysis for Retina with Diseases
267
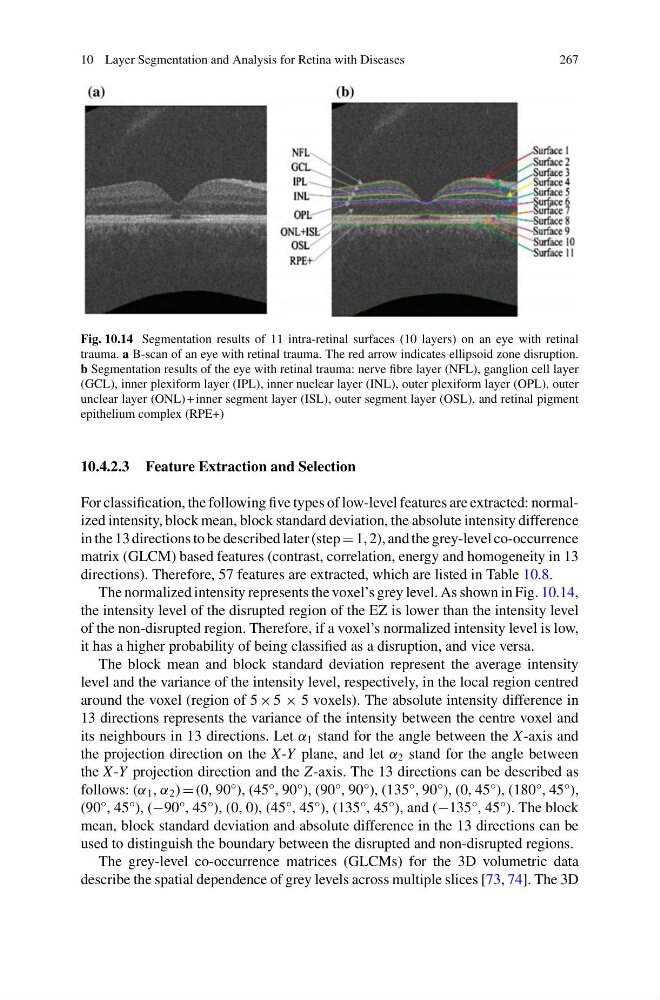
Fig. 10.14 Segmentation results of 11 intra-retinal surfaces (10 layers) on an eye with retinal
trauma. a B-scan of an eye with retinal trauma. The red arrow indicates ellipsoid zone disruption.
b Segmentation results of the eye with retinal trauma: nerve fibre layer (NFL), ganglion cell layer
(GCL), inner plexiform layer (IPL), inner nuclear layer (INL), outer plexiform layer (OPL), outer
unclear layer (ONL) + inner segment layer (ISL), outer segment layer (OSL), and retinal pigment
epithelium complex (RPE+)
10.4.2.3 Feature Extraction and Selection
For classification, the following five types of low-level features are extracted: normalized intensity, block mean, block standard deviation, the absolute intensity difference
in the 13 directions to be described later (step 1, 2), and the grey-level co-occurrence
matrix (GLCM) based features (contrast, correlation, energy and homogeneity in 13
directions). Therefore, 57 features are extracted, which are listed in Table 10.8.
The normalized intensity represents the voxel’s grey level. As shown in Fig. 10.14,
the intensity level of the disrupted region of the EZ is lower than the intensity level
of the non-disrupted region. Therefore, if a voxel’s normalized intensity level is low,
it has a higher probability of being classified as a disruption, and vice versa.
The block mean and block standard deviation represent the average intensity
level and the variance of the intensity level, respectively, in the local region centred
around the voxel (region of 5 × 5 × 5 voxels). The absolute intensity difference in
13 directions represents the variance of the intensity between the centre voxel and
its neighbours in 13 directions. Let α 1 stand for the angle between the X-axis and
the projection direction on the X-Y plane, and let α 2 stand for the angle between
the X-Y projection direction and the Z-axis. The 13 directions can be described as
follows: (α 1 , α 2 ) (0, 90°), (45°, 90°), (90°, 90°), (135°, 90°), (0, 45°), (180°, 45°),
(90°, 45°), (−90°, 45°), (0, 0), (45°, 45°), (135°, 45°), and (−135°, 45°). The block
mean, block standard deviation and absolute difference in the 13 directions can be
used to distinguish the boundary between the disrupted and non-disrupted regions.
The grey-level co-occurrence matrices (GLCMs) for the 3D volumetric data
describe the spatial dependence of grey levels across multiple slices [73, 74]. The 3D
267
Fig. 10.14 Segmentation results of 11 intra-retinal surfaces (10 layers) on an eye with retinal
trauma. a B-scan of an eye with retinal trauma. The red arrow indicates ellipsoid zone disruption.
b Segmentation results of the eye with retinal trauma: nerve fibre layer (NFL), ganglion cell layer
(GCL), inner plexiform layer (IPL), inner nuclear layer (INL), outer plexiform layer (OPL), outer
unclear layer (ONL) + inner segment layer (ISL), outer segment layer (OSL), and retinal pigment
epithelium complex (RPE+)
10.4.2.3 Feature Extraction and Selection
For classification, the following five types of low-level features are extracted: normalized intensity, block mean, block standard deviation, the absolute intensity difference
in the 13 directions to be described later (step 1, 2), and the grey-level co-occurrence
matrix (GLCM) based features (contrast, correlation, energy and homogeneity in 13
directions). Therefore, 57 features are extracted, which are listed in Table 10.8.
The normalized intensity represents the voxel’s grey level. As shown in Fig. 10.14,
the intensity level of the disrupted region of the EZ is lower than the intensity level
of the non-disrupted region. Therefore, if a voxel’s normalized intensity level is low,
it has a higher probability of being classified as a disruption, and vice versa.
The block mean and block standard deviation represent the average intensity
level and the variance of the intensity level, respectively, in the local region centred
around the voxel (region of 5 × 5 × 5 voxels). The absolute intensity difference in
13 directions represents the variance of the intensity between the centre voxel and
its neighbours in 13 directions. Let α 1 stand for the angle between the X-axis and
the projection direction on the X-Y plane, and let α 2 stand for the angle between
the X-Y projection direction and the Z-axis. The 13 directions can be described as
follows: (α 1 , α 2 ) (0, 90°), (45°, 90°), (90°, 90°), (135°, 90°), (0, 45°), (180°, 45°),
(90°, 45°), (−90°, 45°), (0, 0), (45°, 45°), (135°, 45°), and (−135°, 45°). The block
mean, block standard deviation and absolute difference in the 13 directions can be
used to distinguish the boundary between the disrupted and non-disrupted regions.
The grey-level co-occurrence matrices (GLCMs) for the 3D volumetric data
describe the spatial dependence of grey levels across multiple slices [73, 74]. The 3D