

10 Layer Segmentation and Analysis for Retina with Diseases
245
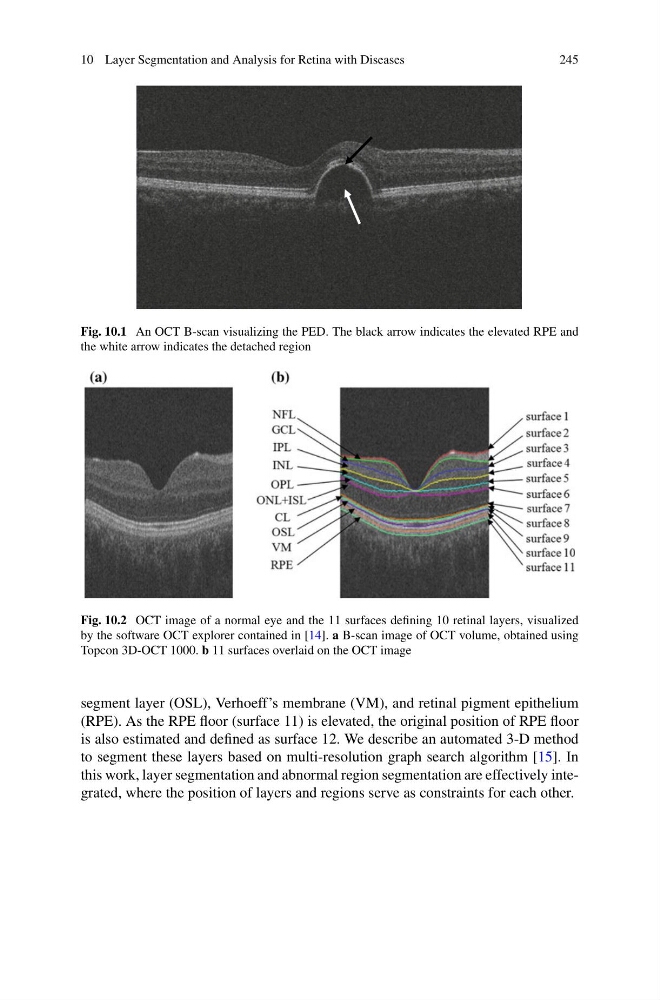
Fig. 10.1 An OCT B-scan visualizing the PED. The black arrow indicates the elevated RPE and
the white arrow indicates the detached region
Fig. 10.2 OCT image of a normal eye and the 11 surfaces defining 10 retinal layers, visualized
by the software OCT explorer contained in [14]. a B-scan image of OCT volume, obtained using
Topcon 3D-OCT 1000. b 11 surfaces overlaid on the OCT image
segment layer (OSL), Verhoeff’s membrane (VM), and retinal pigment epithelium
(RPE). As the RPE floor (surface 11) is elevated, the original position of RPE floor
is also estimated and defined as surface 12. We describe an automated 3-D method
to segment these layers based on multi-resolution graph search algorithm [15]. In
this work, layer segmentation and abnormal region segmentation are effectively integrated, where the position of layers and regions serve as constraints for each other.
245
Fig. 10.1 An OCT B-scan visualizing the PED. The black arrow indicates the elevated RPE and
the white arrow indicates the detached region
Fig. 10.2 OCT image of a normal eye and the 11 surfaces defining 10 retinal layers, visualized
by the software OCT explorer contained in [14]. a B-scan image of OCT volume, obtained using
Topcon 3D-OCT 1000. b 11 surfaces overlaid on the OCT image
segment layer (OSL), Verhoeff’s membrane (VM), and retinal pigment epithelium
(RPE). As the RPE floor (surface 11) is elevated, the original position of RPE floor
is also estimated and defined as surface 12. We describe an automated 3-D method
to segment these layers based on multi-resolution graph search algorithm [15]. In
this work, layer segmentation and abnormal region segmentation are effectively integrated, where the position of layers and regions serve as constraints for each other.