

226
K. K. Vupparaboina et al.
Segmentation
Method for COB
OCT Mode
Dataset
Evaluation
Criterion
Results
Remarks
Gradient based
multistage graph
search approach [22].
SD-OCT. Wavelength,
transverse resolution
and axial resolution
not specified. Images
are averaged 9 times.
37 B-scans per eye, one
eye randomly chosen
per subject, 20 eyes from
20 healthy and 10 eyes
from 10 non-neovascular
AMD adult subjects.
Mean border
position difference
(MBPD), absolute
border position
difference (ABPD),
and correlation
coefficient (CC).
MBPD: -3.90µm (SD 15.93µm),
ABPD: 21.39µm
(SD 10.71µm).
Overall CC: 93% (95% CI, 81%–96%).
(SD-Standard deviation,
CI-Confidence interval).
Observer repeatability and
volume comparison not
reported.
Gradient based
graph search,
posed as dynamic
programing [38].
SD-OCT (EDI †
), 14µm
transverse resolution,
and 3.9µm axial resolution.
Wavelength not specified.
45 B-scans one each
from 45 healthy
adult subjects.
Dice coefficient
(DC).
Mean DC: 90.5% (SD 3%).
Image from each eye that passes
through center of fovea is
selected. Observer repeatability
not reported.Suitability for
volume estimation unclear.
Semi-automated
gradient based
graph search,
posed as dynamic
programing [23].
SD-OCT (EDI †
), 14µm
transverse resolution, and 7µm
axial resolution. Wavelength
not specified. Images
are averaged 100 times.
One B-scan per eye,
one eye randomly
chosen per subject,
30 adult subjects
with diabetes.
Dice coefficient
(DC).
Mean DC: 92.7% (SD 3.6%).
Images close to the foveal
cross section are considered.
Observer repeatability not
reported. Suitability for
volume estimation unclear.
Machine learning
using stochastic
modeling [24].
1060nm SD-OCT (HP ∗
),
15 to 20µm
transverse resolution,
and 7µm axial resolution.
871 B-scans from
12 adult eyes (691
diabetes-1 and 180
advanced pathologies).
Fraction of
misclassified
pixels.
Average error: 13%.
Observer repeatability and
volume comparison not
reported.
Graph cut
segmentation via
machine learning
using multiresolution features [25].
870nm SD-OCT (EDI †
),
14µm transverse
resolution, and 3.9µm
axial resolution.
100 B-scans randomly
chosen from 10
eyes of 6 healthy
adult subjects.
Mean signed
and unsigned
border position
error (MUBPE
and MSBPE).
MUBPE: 9.79 pixels (SD 3.29 pixels),
MSBPE: 5.77 pixels (SD 2.77 pixels).
Images close to the foveal
cross section are considered.
Observer repeatability not
reported.Suitability for
volume estimation unclear.
Graph search, weights
obtained using dual
gradient probabilistic
method, solution using
Dijkstra’s algorithm [19].
870nm SD-OCT (EDI †
), 14µm
transverse resolution, and 3.9µm
axial resolution. Radial images
separated by 30 ◦
centered
around fovea. Images
are averaged 30 times.
1083 pediatric B-scans
from 104 healthy
subjects and 90 adult
B-scans from 15
healthy subjects.
Dice Coefficient
(DC), mean
absolute difference
(MAD).
MAD: 12.6µm (SD 9.00µm) [pediatric];
16.27µm (SD 11.48µm) [adult];
8.01µm (SD 3.34µm) [observer
repeatability].
Mean DC: 97.3% (SD 1.5%) [pediatric];
96.7% (SD 2.1%) [adult].
Images passes through fovea
center are considered. Suitability
for volume estimation
unclear. Observer repeatability
reported in terms of MAD
only for 120 scans.
Structural similarity
(SSIM), and
adaptive Hessian
matrix analysis for
segmentation,
tensor voting for
smoothing [26].
870nm SD-OCT (EDI †
),
14µm transverse
resolution, and 7µm
axial resolution.
Images are averaged
25 times.
97 B-scans per eye,
one eye randomly
chosen per subject,
5 healthy adult
subjects.
Mean absolute
difference (MAD),
Correlation
coefficient (CC),
Dice coefficient
(DC) and absolute
volume difference
(AVD).
Algorithmic
MAD: 19.15µm (SD 15.98µm),
mean CC: 99.64% (SD 0.27%),
mean DC: 95.47% (SD 1.73%),
mean AVD: 0.3046mm 3
.
Observer repeatability
MAD: 11.97µm (SD 10.34µm),
mean CC: 99.82% (SD 0.16%),
mean DC: 97.28% (SD 1.06%),
mean AVD: 0.1240mm 3
.
Scans taken at locations
even far from fovea.
Volumetric analysis performed.
Observer repeatability is
taken into account for
all scans.
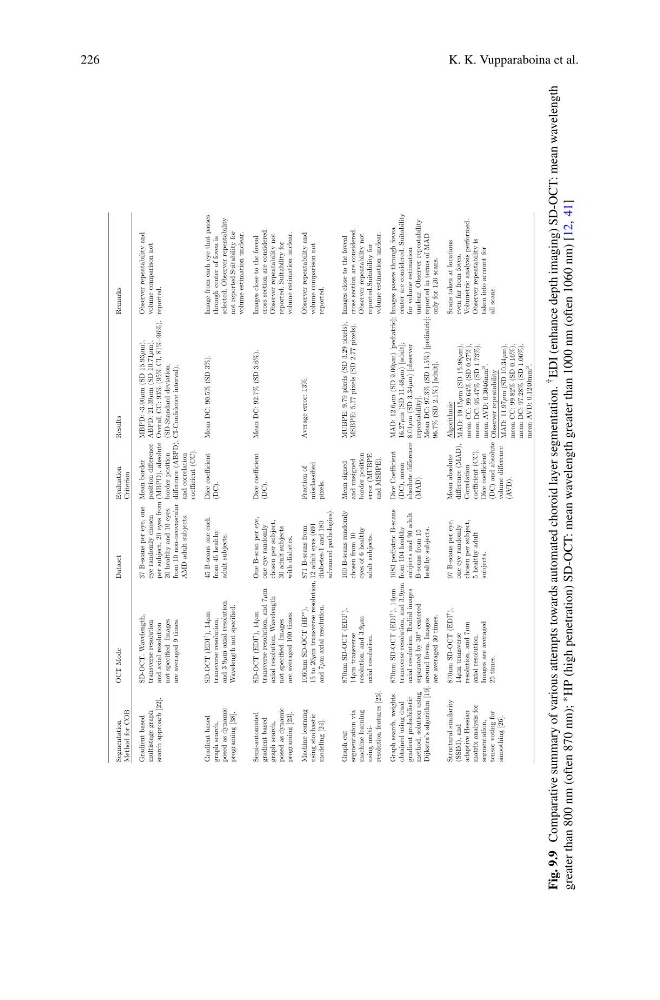
Fig. 9.9
Comparative summary of various attempts towards automated choroid layer segmentation. †
EDI (enhance depth imaging) SD-OCT: mean wavelength
greater than 800 nm (often 870 nm); ∗
HP (high penetration) SD-OCT: mean wavelength greater than 1000 nm (often 1060 nm) [12, 41]
K. K. Vupparaboina et al.
Segmentation
Method for COB
OCT Mode
Dataset
Evaluation
Criterion
Results
Remarks
Gradient based
multistage graph
search approach [22].
SD-OCT. Wavelength,
transverse resolution
and axial resolution
not specified. Images
are averaged 9 times.
37 B-scans per eye, one
eye randomly chosen
per subject, 20 eyes from
20 healthy and 10 eyes
from 10 non-neovascular
AMD adult subjects.
Mean border
position difference
(MBPD), absolute
border position
difference (ABPD),
and correlation
coefficient (CC).
MBPD: -3.90µm (SD 15.93µm),
ABPD: 21.39µm
(SD 10.71µm).
Overall CC: 93% (95% CI, 81%–96%).
(SD-Standard deviation,
CI-Confidence interval).
Observer repeatability and
volume comparison not
reported.
Gradient based
graph search,
posed as dynamic
programing [38].
SD-OCT (EDI †
), 14µm
transverse resolution,
and 3.9µm axial resolution.
Wavelength not specified.
45 B-scans one each
from 45 healthy
adult subjects.
Dice coefficient
(DC).
Mean DC: 90.5% (SD 3%).
Image from each eye that passes
through center of fovea is
selected. Observer repeatability
not reported.Suitability for
volume estimation unclear.
Semi-automated
gradient based
graph search,
posed as dynamic
programing [23].
SD-OCT (EDI †
), 14µm
transverse resolution, and 7µm
axial resolution. Wavelength
not specified. Images
are averaged 100 times.
One B-scan per eye,
one eye randomly
chosen per subject,
30 adult subjects
with diabetes.
Dice coefficient
(DC).
Mean DC: 92.7% (SD 3.6%).
Images close to the foveal
cross section are considered.
Observer repeatability not
reported. Suitability for
volume estimation unclear.
Machine learning
using stochastic
modeling [24].
1060nm SD-OCT (HP ∗
),
15 to 20µm
transverse resolution,
and 7µm axial resolution.
871 B-scans from
12 adult eyes (691
diabetes-1 and 180
advanced pathologies).
Fraction of
misclassified
pixels.
Average error: 13%.
Observer repeatability and
volume comparison not
reported.
Graph cut
segmentation via
machine learning
using multiresolution features [25].
870nm SD-OCT (EDI †
),
14µm transverse
resolution, and 3.9µm
axial resolution.
100 B-scans randomly
chosen from 10
eyes of 6 healthy
adult subjects.
Mean signed
and unsigned
border position
error (MUBPE
and MSBPE).
MUBPE: 9.79 pixels (SD 3.29 pixels),
MSBPE: 5.77 pixels (SD 2.77 pixels).
Images close to the foveal
cross section are considered.
Observer repeatability not
reported.Suitability for
volume estimation unclear.
Graph search, weights
obtained using dual
gradient probabilistic
method, solution using
Dijkstra’s algorithm [19].
870nm SD-OCT (EDI †
), 14µm
transverse resolution, and 3.9µm
axial resolution. Radial images
separated by 30 ◦
centered
around fovea. Images
are averaged 30 times.
1083 pediatric B-scans
from 104 healthy
subjects and 90 adult
B-scans from 15
healthy subjects.
Dice Coefficient
(DC), mean
absolute difference
(MAD).
MAD: 12.6µm (SD 9.00µm) [pediatric];
16.27µm (SD 11.48µm) [adult];
8.01µm (SD 3.34µm) [observer
repeatability].
Mean DC: 97.3% (SD 1.5%) [pediatric];
96.7% (SD 2.1%) [adult].
Images passes through fovea
center are considered. Suitability
for volume estimation
unclear. Observer repeatability
reported in terms of MAD
only for 120 scans.
Structural similarity
(SSIM), and
adaptive Hessian
matrix analysis for
segmentation,
tensor voting for
smoothing [26].
870nm SD-OCT (EDI †
),
14µm transverse
resolution, and 7µm
axial resolution.
Images are averaged
25 times.
97 B-scans per eye,
one eye randomly
chosen per subject,
5 healthy adult
subjects.
Mean absolute
difference (MAD),
Correlation
coefficient (CC),
Dice coefficient
(DC) and absolute
volume difference
(AVD).
Algorithmic
MAD: 19.15µm (SD 15.98µm),
mean CC: 99.64% (SD 0.27%),
mean DC: 95.47% (SD 1.73%),
mean AVD: 0.3046mm 3
.
Observer repeatability
MAD: 11.97µm (SD 10.34µm),
mean CC: 99.82% (SD 0.16%),
mean DC: 97.28% (SD 1.06%),
mean AVD: 0.1240mm 3
.
Scans taken at locations
even far from fovea.
Volumetric analysis performed.
Observer repeatability is
taken into account for
all scans.
Fig. 9.9
Comparative summary of various attempts towards automated choroid layer segmentation. †
EDI (enhance depth imaging) SD-OCT: mean wavelength
greater than 800 nm (often 870 nm); ∗
HP (high penetration) SD-OCT: mean wavelength greater than 1000 nm (often 1060 nm) [12, 41]