

214
K. K. Vupparaboina et al.
diseases. To see this, suppose specific scans are taken at selected foveal locations.
Then the thickness measure would clearly be inadequate in representing the overall
choroidal distribution. In contrast, volumetric analysis of the choroid would be better suited to assess the disease course and response to treatment [17]. Against this
backdrop, SSIM-based method also automated choroidal volume measurement [26].
Turning to performance comparison among algorithms reported, it poses considerable challenge due to various factors. In several cases standard datasets and ground
truth results did not exist. Specifically, algorithms, considered the state of the art,
were tested on disparate datasets, making comparison among those algorithms difficult. Further, as manual measurements are also subjective in nature, those also should
not be used as reference. Against this backdrop, SSIM-based method proposed to
use the variability in manual measurements as the reference, and the compare against
that the variability between mean manual and algorithmic performances [26]. Further, thorough statistical analysis is carried out comparing algorithmic results with
observer repeatability. Importantly, quotient measures are defined to facilitate comparison among algorithms tested on different datasets vis-à-vis manual methods. In
view of above observations, the rest of the section focuses on detailed description
of the SSIM-based methodology for automated quantification of choroidal thickness
and volume.
9.2.2 Materials and Methods
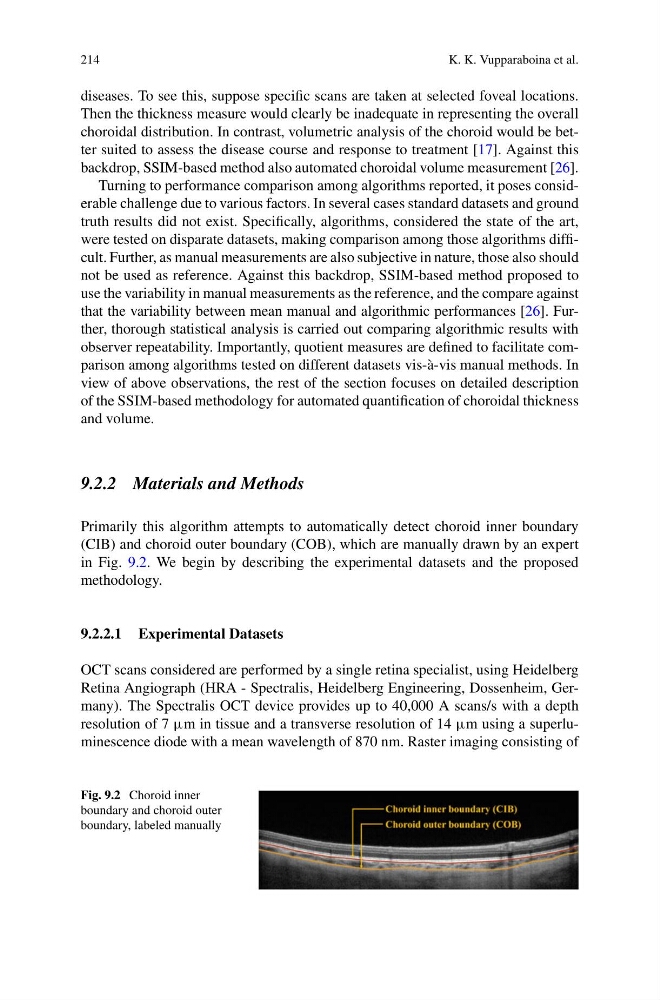
Primarily this algorithm attempts to automatically detect choroid inner boundary
(CIB) and choroid outer boundary (COB), which are manually drawn by an expert
in Fig. 9.2. We begin by describing the experimental datasets and the proposed
methodology.
9.2.2.1 Experimental Datasets
OCT scans considered are performed by a single retina specialist, using Heidelberg
Retina Angiograph (HRA - Spectralis, Heidelberg Engineering, Dossenheim, Germany). The Spectralis OCT device provides up to 40,000 A scans/s with a depth
resolution of 7 µm in tissue and a transverse resolution of 14 µm using a superluminescence diode with a mean wavelength of 870 nm. Raster imaging consisting of
Fig. 9.2 Choroid inner
boundary and choroid outer
boundary, labeled manually
K. K. Vupparaboina et al.
diseases. To see this, suppose specific scans are taken at selected foveal locations.
Then the thickness measure would clearly be inadequate in representing the overall
choroidal distribution. In contrast, volumetric analysis of the choroid would be better suited to assess the disease course and response to treatment [17]. Against this
backdrop, SSIM-based method also automated choroidal volume measurement [26].
Turning to performance comparison among algorithms reported, it poses considerable challenge due to various factors. In several cases standard datasets and ground
truth results did not exist. Specifically, algorithms, considered the state of the art,
were tested on disparate datasets, making comparison among those algorithms difficult. Further, as manual measurements are also subjective in nature, those also should
not be used as reference. Against this backdrop, SSIM-based method proposed to
use the variability in manual measurements as the reference, and the compare against
that the variability between mean manual and algorithmic performances [26]. Further, thorough statistical analysis is carried out comparing algorithmic results with
observer repeatability. Importantly, quotient measures are defined to facilitate comparison among algorithms tested on different datasets vis-à-vis manual methods. In
view of above observations, the rest of the section focuses on detailed description
of the SSIM-based methodology for automated quantification of choroidal thickness
and volume.
9.2.2 Materials and Methods
Primarily this algorithm attempts to automatically detect choroid inner boundary
(CIB) and choroid outer boundary (COB), which are manually drawn by an expert
in Fig. 9.2. We begin by describing the experimental datasets and the proposed
methodology.
9.2.2.1 Experimental Datasets
OCT scans considered are performed by a single retina specialist, using Heidelberg
Retina Angiograph (HRA - Spectralis, Heidelberg Engineering, Dossenheim, Germany). The Spectralis OCT device provides up to 40,000 A scans/s with a depth
resolution of 7 µm in tissue and a transverse resolution of 14 µm using a superluminescence diode with a mean wavelength of 870 nm. Raster imaging consisting of
Fig. 9.2 Choroid inner
boundary and choroid outer
boundary, labeled manually