

212
K. K. Vupparaboina et al.
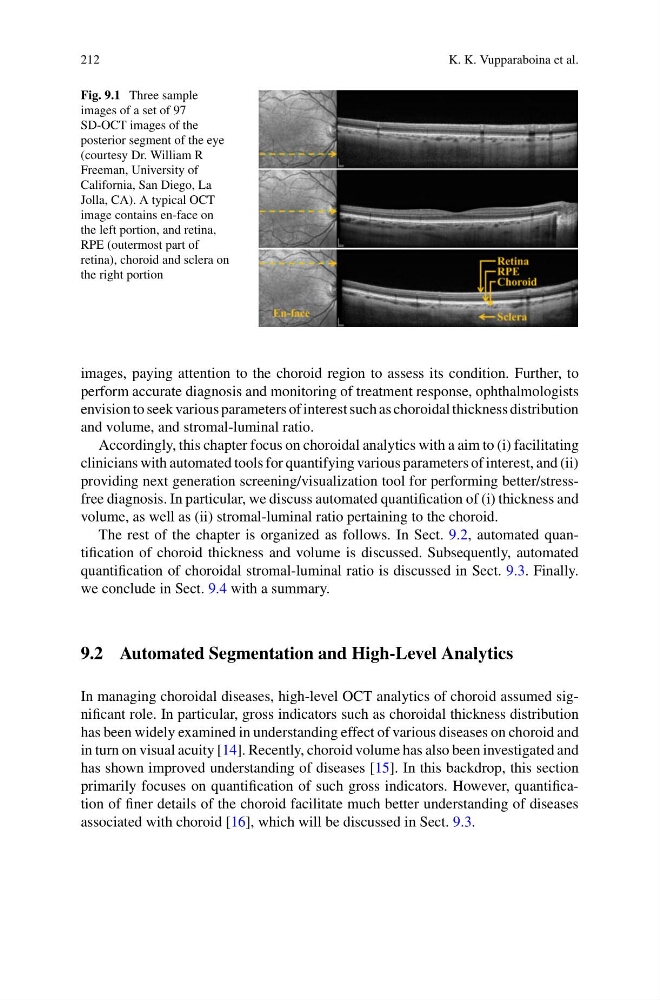
Fig. 9.1 Three sample
images of a set of 97
SD-OCT images of the
posterior segment of the eye
(courtesy Dr. William R
Freeman, University of
California, San Diego, La
Jolla, CA). A typical OCT
image contains en-face on
the left portion, and retina,
RPE (outermost part of
retina), choroid and sclera on
the right portion
images, paying attention to the choroid region to assess its condition. Further, to
perform accurate diagnosis and monitoring of treatment response, ophthalmologists
envision to seek various parameters of interest such as choroidal thickness distribution
and volume, and stromal-luminal ratio.
Accordingly, this chapter focus on choroidal analytics with a aim to (i) facilitating
clinicians with automated tools for quantifying various parameters of interest, and (ii)
providing next generation screening/visualization tool for performing better/stressfree diagnosis. In particular, we discuss automated quantification of (i) thickness and
volume, as well as (ii) stromal-luminal ratio pertaining to the choroid.
The rest of the chapter is organized as follows. In Sect. 9.2, automated quantification of choroid thickness and volume is discussed. Subsequently, automated
quantification of choroidal stromal-luminal ratio is discussed in Sect. 9.3. Finally.
we conclude in Sect. 9.4 with a summary.
9.2 Automated Segmentation and High-Level Analytics
In managing choroidal diseases, high-level OCT analytics of choroid assumed significant role. In particular, gross indicators such as choroidal thickness distribution
has been widely examined in understanding effect of various diseases on choroid and
in turn on visual acuity [14]. Recently, choroid volume has also been investigated and
has shown improved understanding of diseases [15]. In this backdrop, this section
primarily focuses on quantification of such gross indicators. However, quantification of finer details of the choroid facilitate much better understanding of diseases
associated with choroid [16], which will be discussed in Sect. 9.3.
K. K. Vupparaboina et al.
Fig. 9.1 Three sample
images of a set of 97
SD-OCT images of the
posterior segment of the eye
(courtesy Dr. William R
Freeman, University of
California, San Diego, La
Jolla, CA). A typical OCT
image contains en-face on
the left portion, and retina,
RPE (outermost part of
retina), choroid and sclera on
the right portion
images, paying attention to the choroid region to assess its condition. Further, to
perform accurate diagnosis and monitoring of treatment response, ophthalmologists
envision to seek various parameters of interest such as choroidal thickness distribution
and volume, and stromal-luminal ratio.
Accordingly, this chapter focus on choroidal analytics with a aim to (i) facilitating
clinicians with automated tools for quantifying various parameters of interest, and (ii)
providing next generation screening/visualization tool for performing better/stressfree diagnosis. In particular, we discuss automated quantification of (i) thickness and
volume, as well as (ii) stromal-luminal ratio pertaining to the choroid.
The rest of the chapter is organized as follows. In Sect. 9.2, automated quantification of choroid thickness and volume is discussed. Subsequently, automated
quantification of choroidal stromal-luminal ratio is discussed in Sect. 9.3. Finally.
we conclude in Sect. 9.4 with a summary.
9.2 Automated Segmentation and High-Level Analytics
In managing choroidal diseases, high-level OCT analytics of choroid assumed significant role. In particular, gross indicators such as choroidal thickness distribution
has been widely examined in understanding effect of various diseases on choroid and
in turn on visual acuity [14]. Recently, choroid volume has also been investigated and
has shown improved understanding of diseases [15]. In this backdrop, this section
primarily focuses on quantification of such gross indicators. However, quantification of finer details of the choroid facilitate much better understanding of diseases
associated with choroid [16], which will be discussed in Sect. 9.3.