

140
D. Cabrera DeBuc et al.
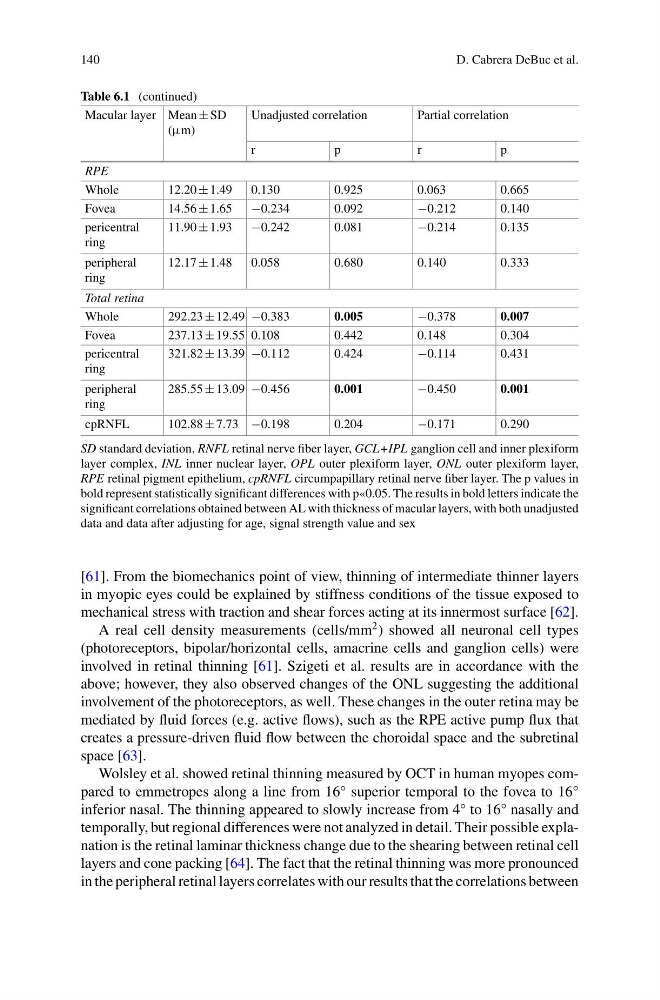
Table 6.1 (continued)
Macular layer Mean ± SD
(µm)
Unadjusted correlation
Partial correlation
r
p
r
p
RPE
Whole
12.20 ± 1.49
0.130
0.925
0.063
0.665
Fovea
14.56 ± 1.65
−0.234
0.092
−0.212
0.140
pericentral
ring
11.90 ± 1.93
−0.242
0.081
−0.214
0.135
peripheral
ring
12.17 ± 1.48
0.058
0.680
0.140
0.333
Total retina
Whole
292.23 ± 12.49 −0.383
0.005
−0.378
0.007
Fovea
237.13 ± 19.55 0.108
0.442
0.148
0.304
pericentral
ring
321.82 ± 13.39 −0.112
0.424
−0.114
0.431
peripheral
ring
285.55 ± 13.09 −0.456
0.001
−0.450
0.001
cpRNFL
102.88 ± 7.73 −0.198
0.204
−0.171
0.290
SD standard deviation, RNFL retinal nerve fiber layer, GCL+IPL ganglion cell and inner plexiform
layer complex, INL inner nuclear layer, OPL outer plexiform layer, ONL outer plexiform layer,
RPE retinal pigment epithelium, cpRNFL circumpapillary retinal nerve fiber layer. The p values in
bold represent statistically significant differences with p«0.05. The results in bold letters indicate the
significant correlations obtained between AL with thickness of macular layers, with both unadjusted
data and data after adjusting for age, signal strength value and sex
[61]. From the biomechanics point of view, thinning of intermediate thinner layers
in myopic eyes could be explained by stiffness conditions of the tissue exposed to
mechanical stress with traction and shear forces acting at its innermost surface [62].
A real cell density measurements (cells/mm
2 ) showed all neuronal cell types
(photoreceptors, bipolar/horizontal cells, amacrine cells and ganglion cells) were
involved in retinal thinning [61]. Szigeti et al. results are in accordance with the
above; however, they also observed changes of the ONL suggesting the additional
involvement of the photoreceptors, as well. These changes in the outer retina may be
mediated by fluid forces (e.g. active flows), such as the RPE active pump flux that
creates a pressure-driven fluid flow between the choroidal space and the subretinal
space [63].
Wolsley et al. showed retinal thinning measured by OCT in human myopes compared to emmetropes along a line from 16° superior temporal to the fovea to 16°
inferior nasal. The thinning appeared to slowly increase from 4° to 16° nasally and
temporally, but regional differences were not analyzed in detail. Their possible explanation is the retinal laminar thickness change due to the shearing between retinal cell
layers and cone packing [64]. The fact that the retinal thinning was more pronounced
in the peripheral retinal layers correlates with our results that the correlations between
D. Cabrera DeBuc et al.
Table 6.1 (continued)
Macular layer Mean ± SD
(µm)
Unadjusted correlation
Partial correlation
r
p
r
p
RPE
Whole
12.20 ± 1.49
0.130
0.925
0.063
0.665
Fovea
14.56 ± 1.65
−0.234
0.092
−0.212
0.140
pericentral
ring
11.90 ± 1.93
−0.242
0.081
−0.214
0.135
peripheral
ring
12.17 ± 1.48
0.058
0.680
0.140
0.333
Total retina
Whole
292.23 ± 12.49 −0.383
0.005
−0.378
0.007
Fovea
237.13 ± 19.55 0.108
0.442
0.148
0.304
pericentral
ring
321.82 ± 13.39 −0.112
0.424
−0.114
0.431
peripheral
ring
285.55 ± 13.09 −0.456
0.001
−0.450
0.001
cpRNFL
102.88 ± 7.73 −0.198
0.204
−0.171
0.290
SD standard deviation, RNFL retinal nerve fiber layer, GCL+IPL ganglion cell and inner plexiform
layer complex, INL inner nuclear layer, OPL outer plexiform layer, ONL outer plexiform layer,
RPE retinal pigment epithelium, cpRNFL circumpapillary retinal nerve fiber layer. The p values in
bold represent statistically significant differences with p«0.05. The results in bold letters indicate the
significant correlations obtained between AL with thickness of macular layers, with both unadjusted
data and data after adjusting for age, signal strength value and sex
[61]. From the biomechanics point of view, thinning of intermediate thinner layers
in myopic eyes could be explained by stiffness conditions of the tissue exposed to
mechanical stress with traction and shear forces acting at its innermost surface [62].
A real cell density measurements (cells/mm
2 ) showed all neuronal cell types
(photoreceptors, bipolar/horizontal cells, amacrine cells and ganglion cells) were
involved in retinal thinning [61]. Szigeti et al. results are in accordance with the
above; however, they also observed changes of the ONL suggesting the additional
involvement of the photoreceptors, as well. These changes in the outer retina may be
mediated by fluid forces (e.g. active flows), such as the RPE active pump flux that
creates a pressure-driven fluid flow between the choroidal space and the subretinal
space [63].
Wolsley et al. showed retinal thinning measured by OCT in human myopes compared to emmetropes along a line from 16° superior temporal to the fovea to 16°
inferior nasal. The thinning appeared to slowly increase from 4° to 16° nasally and
temporally, but regional differences were not analyzed in detail. Their possible explanation is the retinal laminar thickness change due to the shearing between retinal cell
layers and cone packing [64]. The fact that the retinal thinning was more pronounced
in the peripheral retinal layers correlates with our results that the correlations between