

5 Segmentation of OCT Scans Using Probabilistic Graphical Models
115
Table 5.3 Unsigned error for all datasets (c.f. Table 5.1) in μm (1px = 3.87 µm). Boundary numbers
1–9 correspond to Fig. 5.1. Results for other approaches are marked by a citation. Duan et al. [13]
only provide the average result and detailed results for two boundaries
Dataset Type
Avg. 1
2
3
4
5
6
7
8
9
2-D
Healthy 2.92
2.06
4.68
3.67
3.31
3.30
2.10
2.34
2.81
2.01
2-D
PPG
3.64
2.66
6.66
4.57
4.43
4.34
2.67
2.59
2.82
2.06
PGE
3.97
3.76
5.65
5.37
5.78
4.40
2.76
2.95
3.40
1.63
PGM
4.00
4.51
6.74
5.49
5.44
4.15
2.88
2.21
2.94
1.64
PGA
5.62
6.53
9.95
8.80
8.30
5.05
2.99
2.42
4.19
2.36
3-D
Healthy 2.46
1.36
3.32
3.17
3.23
3.27
1.61
1.86
2.27
2.07
3-D
Healthy 3.17
2.93
3.24
3.63
3.92
4.00
1.65
–
3.43
2.61
3.87
[11]
2.67
4.34
3.73
3.89
5.18
2.10
–
6.23
2.83
3.10
[13]
–
–
–
–
3.55
1.57
–
–
–
3-D
Mild
RP
4.08
4.39
4.15
3.84
–
4.65
–
–
–
3.37
4.48
[12]
3.70
4.49
3.84
–
5.75
–
–
–
4.63
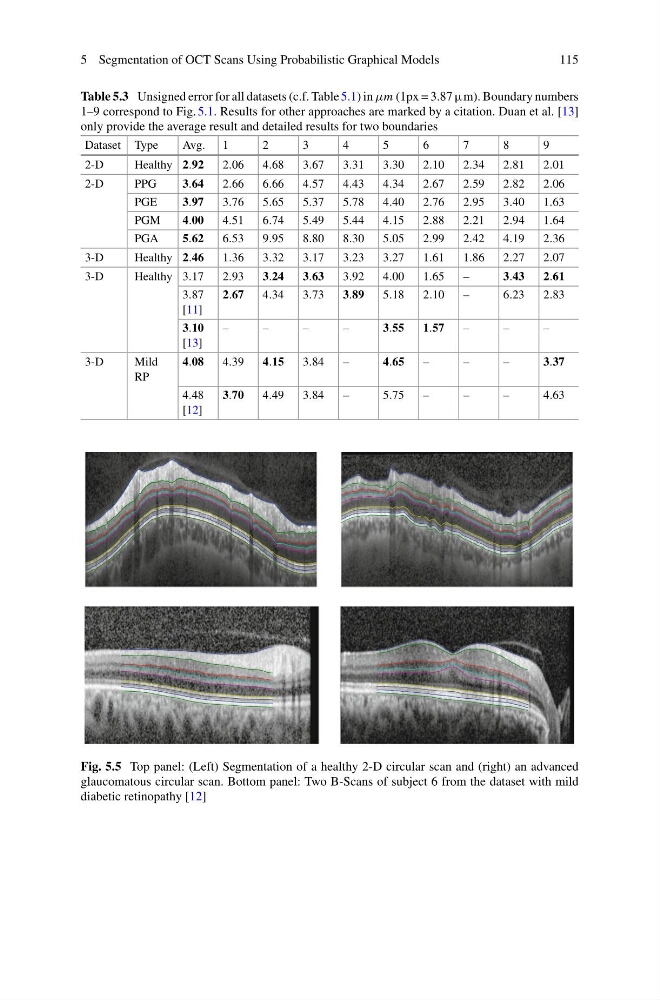
Fig. 5.5 Top panel: (Left) Segmentation of a healthy 2-D circular scan and (right) an advanced
glaucomatous circular scan. Bottom panel: Two B-Scans of subject 6 from the dataset with mild
diabetic retinopathy [12]
115
Table 5.3 Unsigned error for all datasets (c.f. Table 5.1) in μm (1px = 3.87 µm). Boundary numbers
1–9 correspond to Fig. 5.1. Results for other approaches are marked by a citation. Duan et al. [13]
only provide the average result and detailed results for two boundaries
Dataset Type
Avg. 1
2
3
4
5
6
7
8
9
2-D
Healthy 2.92
2.06
4.68
3.67
3.31
3.30
2.10
2.34
2.81
2.01
2-D
PPG
3.64
2.66
6.66
4.57
4.43
4.34
2.67
2.59
2.82
2.06
PGE
3.97
3.76
5.65
5.37
5.78
4.40
2.76
2.95
3.40
1.63
PGM
4.00
4.51
6.74
5.49
5.44
4.15
2.88
2.21
2.94
1.64
PGA
5.62
6.53
9.95
8.80
8.30
5.05
2.99
2.42
4.19
2.36
3-D
Healthy 2.46
1.36
3.32
3.17
3.23
3.27
1.61
1.86
2.27
2.07
3-D
Healthy 3.17
2.93
3.24
3.63
3.92
4.00
1.65
–
3.43
2.61
3.87
[11]
2.67
4.34
3.73
3.89
5.18
2.10
–
6.23
2.83
3.10
[13]
–
–
–
–
3.55
1.57
–
–
–
3-D
Mild
RP
4.08
4.39
4.15
3.84
–
4.65
–
–
–
3.37
4.48
[12]
3.70
4.49
3.84
–
5.75
–
–
–
4.63
Fig. 5.5 Top panel: (Left) Segmentation of a healthy 2-D circular scan and (right) an advanced
glaucomatous circular scan. Bottom panel: Two B-Scans of subject 6 from the dataset with mild
diabetic retinopathy [12]