

90
L. Fang and S. Li
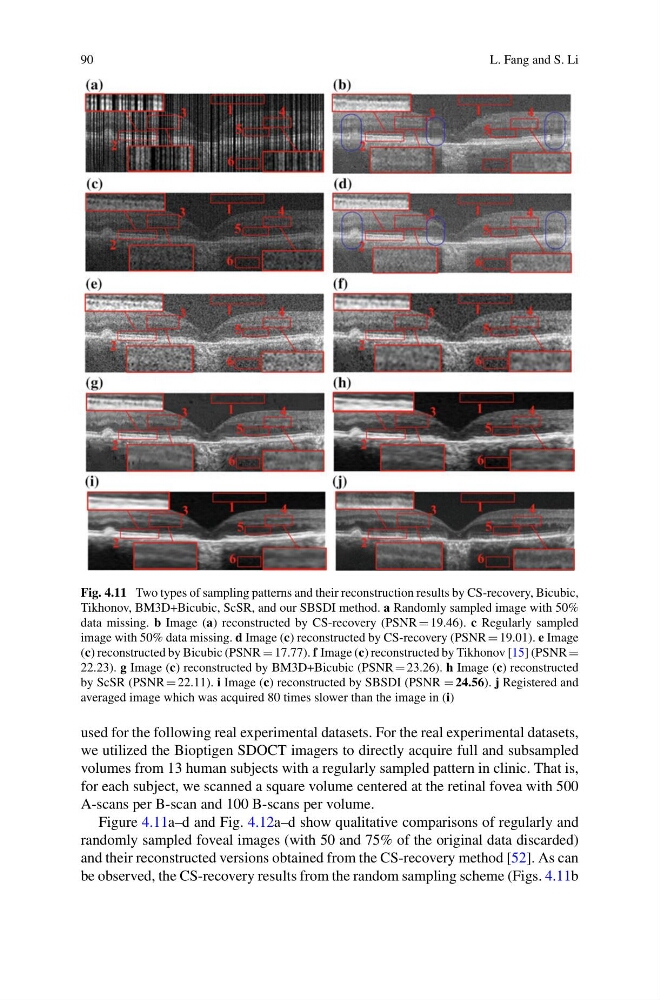
Fig. 4.11 Two types of sampling patterns and their reconstruction results by CS-recovery, Bicubic,
Tikhonov, BM3D+Bicubic, ScSR, and our SBSDI method. a Randomly sampled image with 50%
data missing. b Image (a) reconstructed by CS-recovery (PSNR 19.46). c Regularly sampled
image with 50% data missing. d Image (c) reconstructed by CS-recovery (PSNR 19.01). e Image
(c) reconstructed by Bicubic (PSNR 17.77). f Image (c) reconstructed by Tikhonov [15] (PSNR
22.23). g Image (c) reconstructed by BM3D+Bicubic (PSNR 23.26). h Image (c) reconstructed
by ScSR (PSNR 22.11). i Image (c) reconstructed by SBSDI (PSNR 24.56). j Registered and
averaged image which was acquired 80 times slower than the image in (i)
used for the following real experimental datasets. For the real experimental datasets,
we utilized the Bioptigen SDOCT imagers to directly acquire full and subsampled
volumes from 13 human subjects with a regularly sampled pattern in clinic. That is,
for each subject, we scanned a square volume centered at the retinal fovea with 500
A-scans per B-scan and 100 B-scans per volume.
Figure 4.11a–d and Fig. 4.12a–d show qualitative comparisons of regularly and
randomly sampled foveal images (with 50 and 75% of the original data discarded)
and their reconstructed versions obtained from the CS-recovery method [52]. As can
be observed, the CS-recovery results from the random sampling scheme (Figs. 4.11b
L. Fang and S. Li
Fig. 4.11 Two types of sampling patterns and their reconstruction results by CS-recovery, Bicubic,
Tikhonov, BM3D+Bicubic, ScSR, and our SBSDI method. a Randomly sampled image with 50%
data missing. b Image (a) reconstructed by CS-recovery (PSNR 19.46). c Regularly sampled
image with 50% data missing. d Image (c) reconstructed by CS-recovery (PSNR 19.01). e Image
(c) reconstructed by Bicubic (PSNR 17.77). f Image (c) reconstructed by Tikhonov [15] (PSNR
22.23). g Image (c) reconstructed by BM3D+Bicubic (PSNR 23.26). h Image (c) reconstructed
by ScSR (PSNR 22.11). i Image (c) reconstructed by SBSDI (PSNR 24.56). j Registered and
averaged image which was acquired 80 times slower than the image in (i)
used for the following real experimental datasets. For the real experimental datasets,
we utilized the Bioptigen SDOCT imagers to directly acquire full and subsampled
volumes from 13 human subjects with a regularly sampled pattern in clinic. That is,
for each subject, we scanned a square volume centered at the retinal fovea with 500
A-scans per B-scan and 100 B-scans per volume.
Figure 4.11a–d and Fig. 4.12a–d show qualitative comparisons of regularly and
randomly sampled foveal images (with 50 and 75% of the original data discarded)
and their reconstructed versions obtained from the CS-recovery method [52]. As can
be observed, the CS-recovery results from the random sampling scheme (Figs. 4.11b