

Spectroscopy of Rydberg Atomic Systems in a Black-Body Radiation Field
57
Table 2 Effective lifetime (μs) of the nP, nD Rydberg states in the sodium spectrum for the
temperatures T = 300, 600 K: [2]—theory by Beterov et al. and this work
N
T = 300 K
P 1/2
P 3/2
[1]
T = 300 K
P 1/2
P 3/2
This work
T = 600 K
P 1/2
P 3/2
This work
T = 300 K
D 3/2
D 5/2
This work
T = 600 K
D 3/2
D 5/2
This work
10
4.80
4.76
4.84
4.81
2.84
2.83
0.913
0.914
0.837
0.838
15
11.59
11.51
11.64
11.57
6.40
6.38
2.847
2.848
2.457
2.458
20
20.99
20.89
21.06
20.96
11.42
11.38
6.263
6.266
5.164
5.167
25
33.33
33.21
33.42
33.32
17.96
17.86
11.465
11.468
9.095
9.098
30
48.71
48.56
48.84
48.70
26.03
25.97
18.602
18.609
14.281
14.285
In Table 2, we present our theoretical data on the effective lifetime of the sodium
nP, nD Rydberg states and some theoretical data by Beterov et al. [1, 2] for comparison
for temperatures T = 300, 600 K.
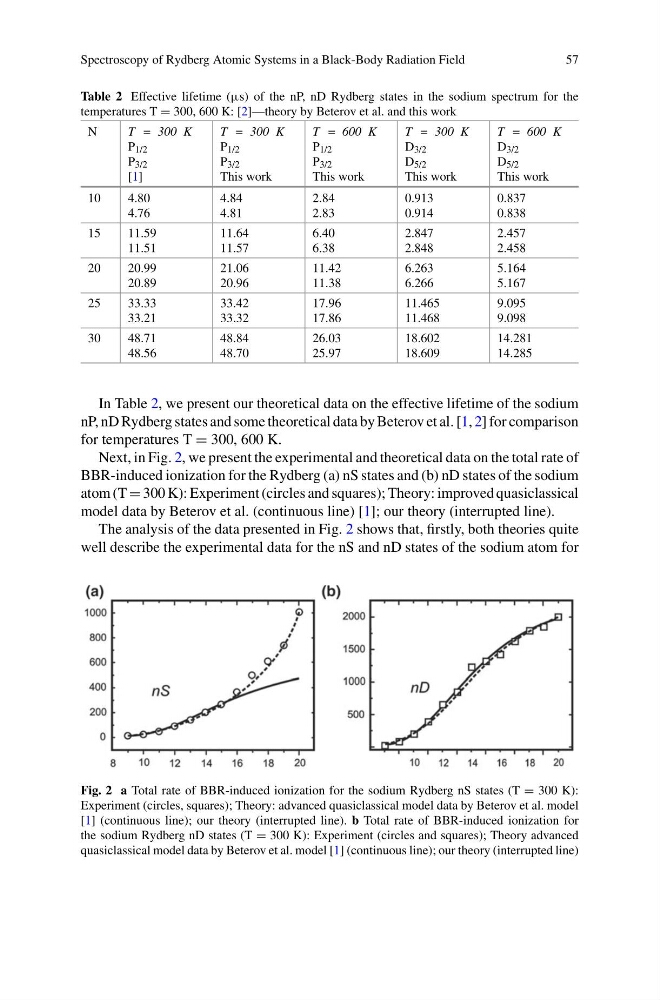
Next, in Fig. 2, we present the experimental and theoretical data on the total rate of
BBR-induced ionization for the Rydberg (a) nS states and (b) nD states of the sodium
atom (T = 300 K): Experiment (circles and squares); Theory: improved quasiclassical
model data by Beterov et al. (continuous line) [1]; our theory (interrupted line).
The analysis of the data presented in Fig. 2 shows that, firstly, both theories quite
well describe the experimental data for the nS and nD states of the sodium atom for
Fig. 2 a Total rate of BBR-induced ionization for the sodium Rydberg nS states (T = 300 K):
Experiment (circles, squares); Theory: advanced quasiclassical model data by Beterov et al. model
[1] (continuous line); our theory (interrupted line). b Total rate of BBR-induced ionization for
the sodium Rydberg nD states (T = 300 K): Experiment (circles and squares); Theory advanced
quasiclassical model data by Beterov et al. model [1] (continuous line); our theory (interrupted line)
57
Table 2 Effective lifetime (μs) of the nP, nD Rydberg states in the sodium spectrum for the
temperatures T = 300, 600 K: [2]—theory by Beterov et al. and this work
N
T = 300 K
P 1/2
P 3/2
[1]
T = 300 K
P 1/2
P 3/2
This work
T = 600 K
P 1/2
P 3/2
This work
T = 300 K
D 3/2
D 5/2
This work
T = 600 K
D 3/2
D 5/2
This work
10
4.80
4.76
4.84
4.81
2.84
2.83
0.913
0.914
0.837
0.838
15
11.59
11.51
11.64
11.57
6.40
6.38
2.847
2.848
2.457
2.458
20
20.99
20.89
21.06
20.96
11.42
11.38
6.263
6.266
5.164
5.167
25
33.33
33.21
33.42
33.32
17.96
17.86
11.465
11.468
9.095
9.098
30
48.71
48.56
48.84
48.70
26.03
25.97
18.602
18.609
14.281
14.285
In Table 2, we present our theoretical data on the effective lifetime of the sodium
nP, nD Rydberg states and some theoretical data by Beterov et al. [1, 2] for comparison
for temperatures T = 300, 600 K.
Next, in Fig. 2, we present the experimental and theoretical data on the total rate of
BBR-induced ionization for the Rydberg (a) nS states and (b) nD states of the sodium
atom (T = 300 K): Experiment (circles and squares); Theory: improved quasiclassical
model data by Beterov et al. (continuous line) [1]; our theory (interrupted line).
The analysis of the data presented in Fig. 2 shows that, firstly, both theories quite
well describe the experimental data for the nS and nD states of the sodium atom for
Fig. 2 a Total rate of BBR-induced ionization for the sodium Rydberg nS states (T = 300 K):
Experiment (circles, squares); Theory: advanced quasiclassical model data by Beterov et al. model
[1] (continuous line); our theory (interrupted line). b Total rate of BBR-induced ionization for
the sodium Rydberg nD states (T = 300 K): Experiment (circles and squares); Theory advanced
quasiclassical model data by Beterov et al. model [1] (continuous line); our theory (interrupted line)