

146
I. F. Elegbeleye et al.
Ru
N
N
N
N
N
N
C
C
C
C
C
C
C
C
C
C
C
C
C
C
C
C
C
C
C
C
C
O
O
H
C
O
O
H
C
O
O
H
C
O
O
H
C
C
S
S
H
H
H
H
H
H
H
H
H
H
H
H
H
H
H
H
40
38
32
34
37
41
39
35
55
54
56
57
8
36
33
11
7
4
2
6
3
5
10
9
50
51
53
52
62
60
58
1
59
61
63
18
20
21
15
19
17
14
12
13
16
28
24
22
23
25
29
27
31
47
46
48
49
43
42
44
45
30
26
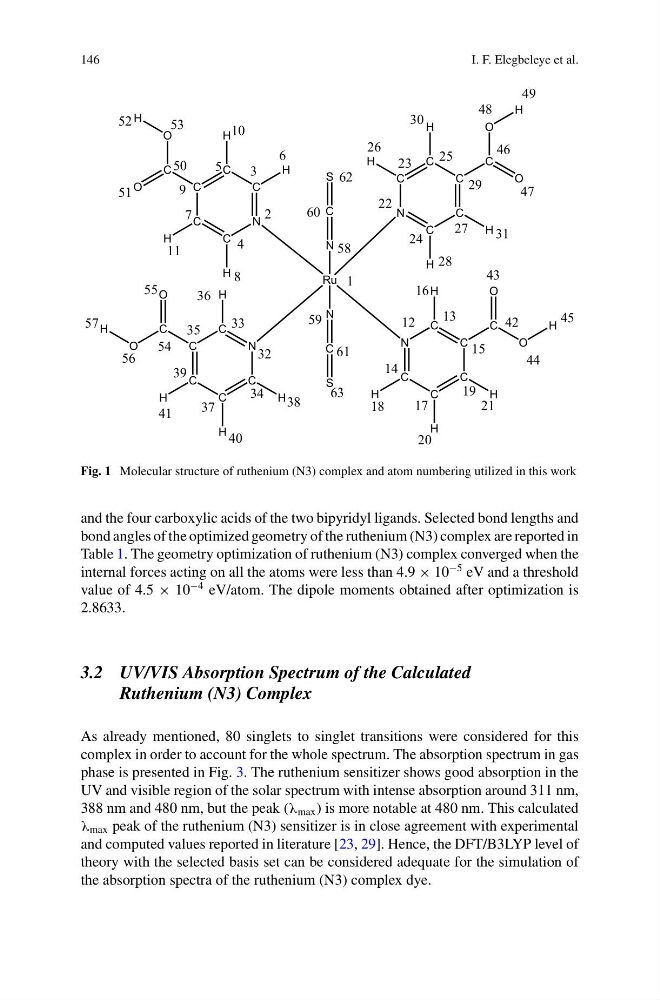
Fig. 1 Molecular structure of ruthenium (N3) complex and atom numbering utilized in this work
and the four carboxylic acids of the two bipyridyl ligands. Selected bond lengths and
bond angles of the optimized geometry of the ruthenium (N3) complex are reported in
Table 1. The geometry optimization of ruthenium (N3) complex converged when the
internal forces acting on all the atoms were less than 4.9 × 10
−5 eV and a threshold
value of 4.5 × 10
−4 eV/atom. The dipole moments obtained after optimization is
2.8633.
3.2 UV/VIS Absorption Spectrum of the Calculated
Ruthenium (N3) Complex
As already mentioned, 80 singlets to singlet transitions were considered for this
complex in order to account for the whole spectrum. The absorption spectrum in gas
phase is presented in Fig. 3. The ruthenium sensitizer shows good absorption in the
UV and visible region of the solar spectrum with intense absorption around 311 nm,
388 nm and 480 nm, but the peak (λ max ) is more notable at 480 nm. This calculated
λ max peak of the ruthenium (N3) sensitizer is in close agreement with experimental
and computed values reported in literature [23, 29]. Hence, the DFT/B3LYP level of
theory with the selected basis set can be considered adequate for the simulation of
the absorption spectra of the ruthenium (N3) complex dye.
I. F. Elegbeleye et al.
Ru
N
N
N
N
N
N
C
C
C
C
C
C
C
C
C
C
C
C
C
C
C
C
C
C
C
C
C
O
O
H
C
O
O
H
C
O
O
H
C
O
O
H
C
C
S
S
H
H
H
H
H
H
H
H
H
H
H
H
H
H
H
H
40
38
32
34
37
41
39
35
55
54
56
57
8
36
33
11
7
4
2
6
3
5
10
9
50
51
53
52
62
60
58
1
59
61
63
18
20
21
15
19
17
14
12
13
16
28
24
22
23
25
29
27
31
47
46
48
49
43
42
44
45
30
26
Fig. 1 Molecular structure of ruthenium (N3) complex and atom numbering utilized in this work
and the four carboxylic acids of the two bipyridyl ligands. Selected bond lengths and
bond angles of the optimized geometry of the ruthenium (N3) complex are reported in
Table 1. The geometry optimization of ruthenium (N3) complex converged when the
internal forces acting on all the atoms were less than 4.9 × 10
−5 eV and a threshold
value of 4.5 × 10
−4 eV/atom. The dipole moments obtained after optimization is
2.8633.
3.2 UV/VIS Absorption Spectrum of the Calculated
Ruthenium (N3) Complex
As already mentioned, 80 singlets to singlet transitions were considered for this
complex in order to account for the whole spectrum. The absorption spectrum in gas
phase is presented in Fig. 3. The ruthenium sensitizer shows good absorption in the
UV and visible region of the solar spectrum with intense absorption around 311 nm,
388 nm and 480 nm, but the peak (λ max ) is more notable at 480 nm. This calculated
λ max peak of the ruthenium (N3) sensitizer is in close agreement with experimental
and computed values reported in literature [23, 29]. Hence, the DFT/B3LYP level of
theory with the selected basis set can be considered adequate for the simulation of
the absorption spectra of the ruthenium (N3) complex dye.