

10
Sensemaking in Safety Critical and Complex Situations
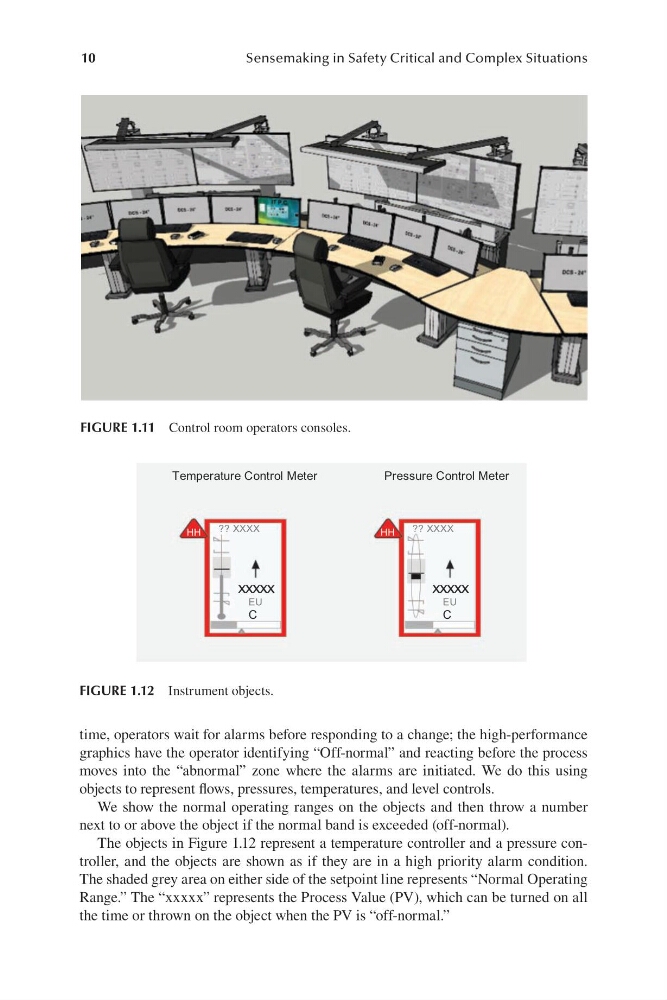
FIGURE 1.11 Control room operators consoles.
Temperature Control Meter
P ressure Control Meter
HH
HH
XXXXX
EU
C
?? XXXX
XXXXX
EU
C
?? XXXX
FIGURE 1.12 Instrument objects.
time, operators wait for alarms before responding to a change; the h igh-performance
graphics have the operator identifying “ Off-normal” and reacting before the process
moves into the “a bnormal” zone where the alarms are initiated. We do this using
objects to represent flows, pressures, temperatures, and level controls.
We show the normal operating ranges on the objects and then throw a number
next to or above the object if the normal band is exceeded ( off-normal).
The objects in F igure 1.12 represent a temperature controller and a pressure controller, and the objects are shown as if they are in a high priority alarm condition.
The shaded grey area on either side of the setpoint line represents “N ormal Operating
Range.” The “x xxxx” represents the Process Value (PV), which can be turned on all
the time or thrown on the object when the PV is “ off-normal.”
Sensemaking in Safety Critical and Complex Situations
FIGURE 1.11 Control room operators consoles.
Temperature Control Meter
P ressure Control Meter
HH
HH
XXXXX
EU
C
?? XXXX
XXXXX
EU
C
?? XXXX
FIGURE 1.12 Instrument objects.
time, operators wait for alarms before responding to a change; the h igh-performance
graphics have the operator identifying “ Off-normal” and reacting before the process
moves into the “a bnormal” zone where the alarms are initiated. We do this using
objects to represent flows, pressures, temperatures, and level controls.
We show the normal operating ranges on the objects and then throw a number
next to or above the object if the normal band is exceeded ( off-normal).
The objects in F igure 1.12 represent a temperature controller and a pressure controller, and the objects are shown as if they are in a high priority alarm condition.
The shaded grey area on either side of the setpoint line represents “N ormal Operating
Range.” The “x xxxx” represents the Process Value (PV), which can be turned on all
the time or thrown on the object when the PV is “ off-normal.”