

254
Sensemaking in Safety Critical and Complex Situations
OVERVIEW DISPLAYS FOR IMPROVED SITUATION AWARENESS
Based on studies like the ones mentioned in the previous section, IFE has worked
extensively with the petroleum and nuclear industry to explore concepts and solutions that would take advantage of new possibilities as well as mitigate some of the
challenges associated with the emerging computerized interfaces, see Braseth et al.
( 2009) for a summary. Among the most influential concepts that has been developed is the shared overview display, sometimes also referred to as a Large Overview
Display or G roup-View Display. The purpose of an overview display is to provide
individuals and teams in the control room with an at - a-glance overview of the most
important safety-critical process parameters at a fixed location in the room, enabling
them to quickly assess the current situation, notice deviations early and to prioritize
effectively between multiple events without having to “ dig” for information in the
control system ( navigate). After a series of lab studies, industry development projects
and experience reviews, a growing body of knowledge attests to their effectiveness
( see Laarni et al., 2009; Hurlen et al., 2015; Kortschot et al., 2018; Kaarstad & Strand,
2011; Roth et al., 2001; Veland et al., 2010). When combined with fully flexible interfaces, a well-designed overview display enables the operators simultaneously to
adapt the HMI to changing circumstances and to quickly assess the “ big picture”
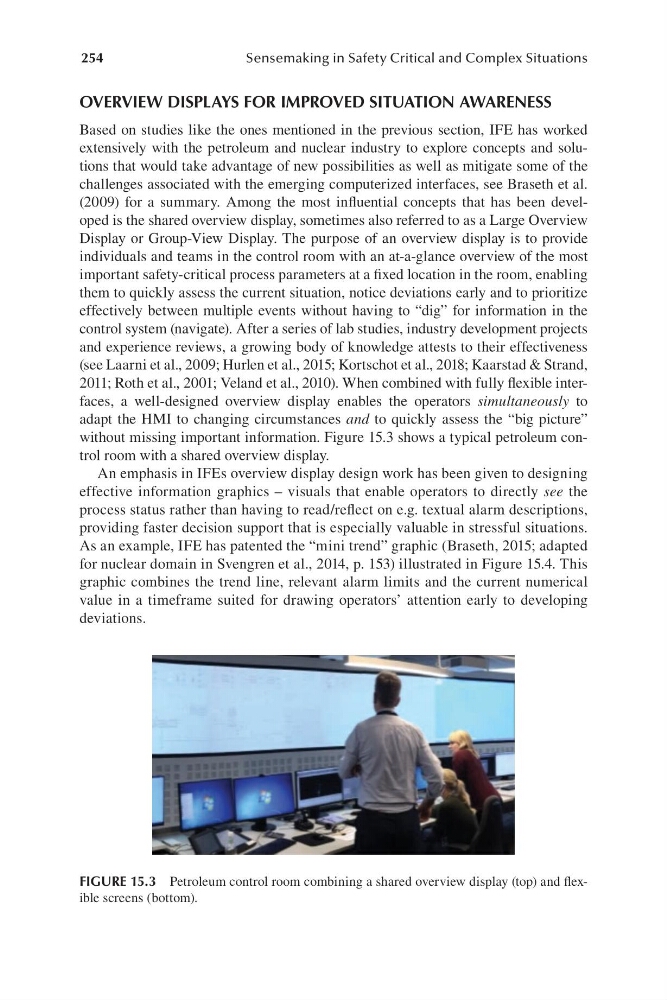
without missing important information. F igure 15.3 shows a typical petroleum control room with a shared overview display.
An emphasis in IFEs overview display design work has been given to designing
effective information graphics – visuals that enable operators to directly see the
process status rather than having to read/ reflect on e.g. textual alarm descriptions,
providing faster decision support that is especially valuable in stressful situations.
As an example, IFE has patented the “ mini trend” graphic ( Braseth, 2015; adapted
for nuclear domain in Svengren et al., 2014, p. 153) illustrated in Figure 15.4. This
graphic combines the trend line, relevant alarm limits and the current numerical
value in a timeframe suited for drawing operators’ attention early to developing
deviations.
FIGURE 15.3 Petroleum control room combining a shared overview display ( top) and flexible screens ( bottom).
Sensemaking in Safety Critical and Complex Situations
OVERVIEW DISPLAYS FOR IMPROVED SITUATION AWARENESS
Based on studies like the ones mentioned in the previous section, IFE has worked
extensively with the petroleum and nuclear industry to explore concepts and solutions that would take advantage of new possibilities as well as mitigate some of the
challenges associated with the emerging computerized interfaces, see Braseth et al.
( 2009) for a summary. Among the most influential concepts that has been developed is the shared overview display, sometimes also referred to as a Large Overview
Display or G roup-View Display. The purpose of an overview display is to provide
individuals and teams in the control room with an at - a-glance overview of the most
important safety-critical process parameters at a fixed location in the room, enabling
them to quickly assess the current situation, notice deviations early and to prioritize
effectively between multiple events without having to “ dig” for information in the
control system ( navigate). After a series of lab studies, industry development projects
and experience reviews, a growing body of knowledge attests to their effectiveness
( see Laarni et al., 2009; Hurlen et al., 2015; Kortschot et al., 2018; Kaarstad & Strand,
2011; Roth et al., 2001; Veland et al., 2010). When combined with fully flexible interfaces, a well-designed overview display enables the operators simultaneously to
adapt the HMI to changing circumstances and to quickly assess the “ big picture”
without missing important information. F igure 15.3 shows a typical petroleum control room with a shared overview display.
An emphasis in IFEs overview display design work has been given to designing
effective information graphics – visuals that enable operators to directly see the
process status rather than having to read/ reflect on e.g. textual alarm descriptions,
providing faster decision support that is especially valuable in stressful situations.
As an example, IFE has patented the “ mini trend” graphic ( Braseth, 2015; adapted
for nuclear domain in Svengren et al., 2014, p. 153) illustrated in Figure 15.4. This
graphic combines the trend line, relevant alarm limits and the current numerical
value in a timeframe suited for drawing operators’ attention early to developing
deviations.
FIGURE 15.3 Petroleum control room combining a shared overview display ( top) and flexible screens ( bottom).