

3
How HMI Has Been Evolving
conditions. The operator keyboard shown in Figure 1.4 is designed to ease navigation
to these groups, providing a quick indication of the pages with active alarms through
function keys with alarm lights.
However, this gave you a k ey-hole view of the process and no total overview
(Figure 1.5).
As technology became available and had more capability, a new graphic HMI presentation evolved, allowing more information to be added and displayed: The move
from a page of 8 controller groups to new process display pictures on a black background using multiple colours to represent equipment and instrumentation values.
The industry did not spend any time deciding what to use for these displays. They
observed engineers using two document types to interpret the process: a process flow
diagram ( PFDs) document that provided an overview of the process and on a more
detailed level, the Process and Instrument Drawing ( P&ID), including more details
than a PFD documenting major and minor flows, control loops and instrumentation
which became the main control system view of the plant.
Engineers quickly latched onto the P&ID and PFD diagram and broke them up
into individual screens. Operators initially did not like them as they lost the optimization of controls being grouped on a page. They now experienced difficulty and
navigation issues as operators had to find controllers on hundreds of P&ID pages and
not grouped based on tasks as the previous design.
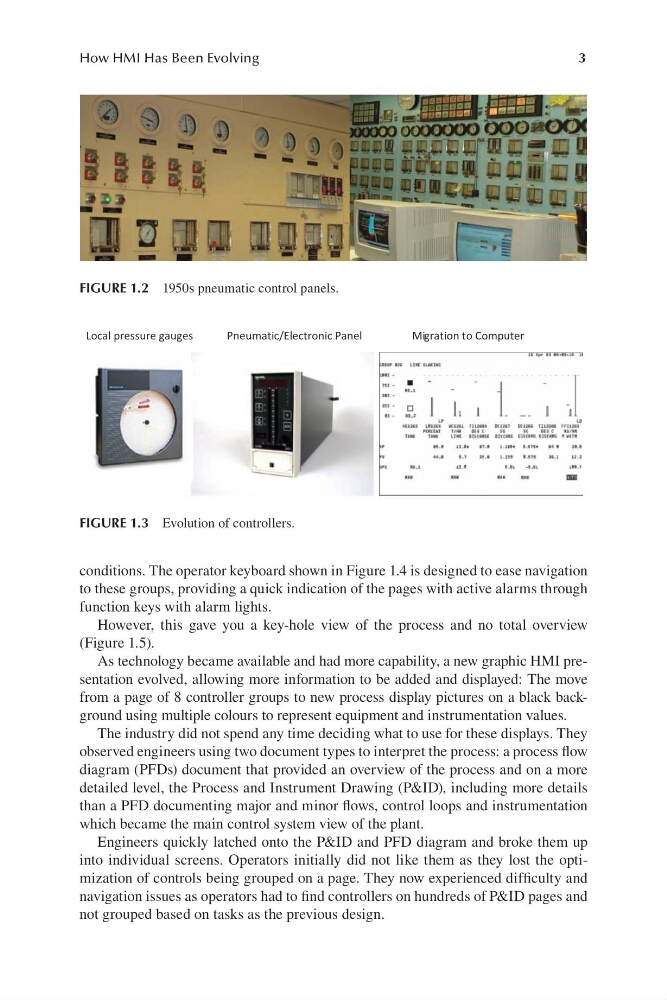
FIGURE 1.2 1950s pneumatic control panels.
Local pressure gauges
Pneumatic/Electronic Panel
Migration to Computer
FIGURE 1.3 Evolution of controllers.
How HMI Has Been Evolving
conditions. The operator keyboard shown in Figure 1.4 is designed to ease navigation
to these groups, providing a quick indication of the pages with active alarms through
function keys with alarm lights.
However, this gave you a k ey-hole view of the process and no total overview
(Figure 1.5).
As technology became available and had more capability, a new graphic HMI presentation evolved, allowing more information to be added and displayed: The move
from a page of 8 controller groups to new process display pictures on a black background using multiple colours to represent equipment and instrumentation values.
The industry did not spend any time deciding what to use for these displays. They
observed engineers using two document types to interpret the process: a process flow
diagram ( PFDs) document that provided an overview of the process and on a more
detailed level, the Process and Instrument Drawing ( P&ID), including more details
than a PFD documenting major and minor flows, control loops and instrumentation
which became the main control system view of the plant.
Engineers quickly latched onto the P&ID and PFD diagram and broke them up
into individual screens. Operators initially did not like them as they lost the optimization of controls being grouped on a page. They now experienced difficulty and
navigation issues as operators had to find controllers on hundreds of P&ID pages and
not grouped based on tasks as the previous design.
FIGURE 1.2 1950s pneumatic control panels.
Local pressure gauges
Pneumatic/Electronic Panel
Migration to Computer
FIGURE 1.3 Evolution of controllers.