

Linear optics measurement and correction - II 145
0.1
0.2
0.3 tune
10
-1
10
0
10
1
10
2
FFT
raw x, y
0.1
0.2
0.3 tune
10
-1
10
0
10
1
10
2
FFT
s 3 , s 1
0
0.1
0.2
Ax (mm)
0
20
40
60
80
100
120
140
160
180
BPM index
0
0.2
Ay (mm)
x
y
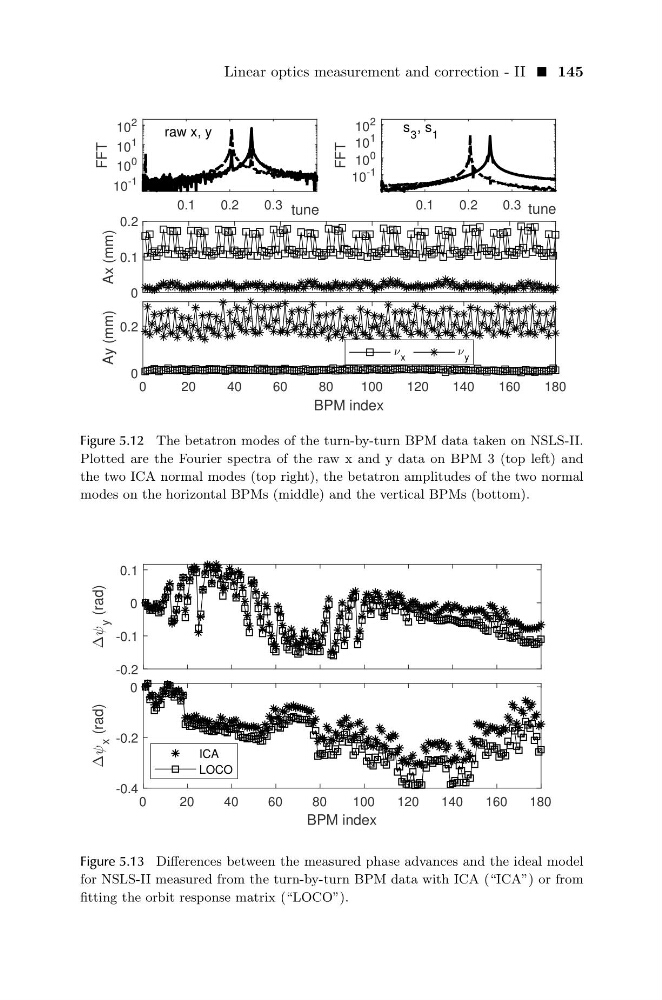
Figure 5.12 The betatron modes of the turn-by-turn BPM data taken on NSLS-II.
Plotted are the Fourier spectra of the raw x and y data on BPM 3 (top left) and
the two ICA normal modes (top right), the betatron amplitudes of the two normal
modes on the horizontal BPMs (middle) and the vertical BPMs (bottom).
-0.2
-0.1
0
0.1
y
(rad)
0
20
40
60
80
100
120
140
160
180
BPM index
-0.4
-0.2
0
x
(rad)
ICA
LOCO
Figure 5.13 Differences between the measured phase advances and the ideal model
for NSLS-II measured from the turn-by-turn BPM data with ICA (“ICA”) or from
fitting the orbit response matrix (“LOCO”).
0.1
0.2
0.3 tune
10
-1
10
0
10
1
10
2
FFT
raw x, y
0.1
0.2
0.3 tune
10
-1
10
0
10
1
10
2
FFT
s 3 , s 1
0
0.1
0.2
Ax (mm)
0
20
40
60
80
100
120
140
160
180
BPM index
0
0.2
Ay (mm)
x
y
Figure 5.12 The betatron modes of the turn-by-turn BPM data taken on NSLS-II.
Plotted are the Fourier spectra of the raw x and y data on BPM 3 (top left) and
the two ICA normal modes (top right), the betatron amplitudes of the two normal
modes on the horizontal BPMs (middle) and the vertical BPMs (bottom).
-0.2
-0.1
0
0.1
y
(rad)
0
20
40
60
80
100
120
140
160
180
BPM index
-0.4
-0.2
0
x
(rad)
ICA
LOCO
Figure 5.13 Differences between the measured phase advances and the ideal model
for NSLS-II measured from the turn-by-turn BPM data with ICA (“ICA”) or from
fitting the orbit response matrix (“LOCO”).