

Linear optics measurement and correction - II 143
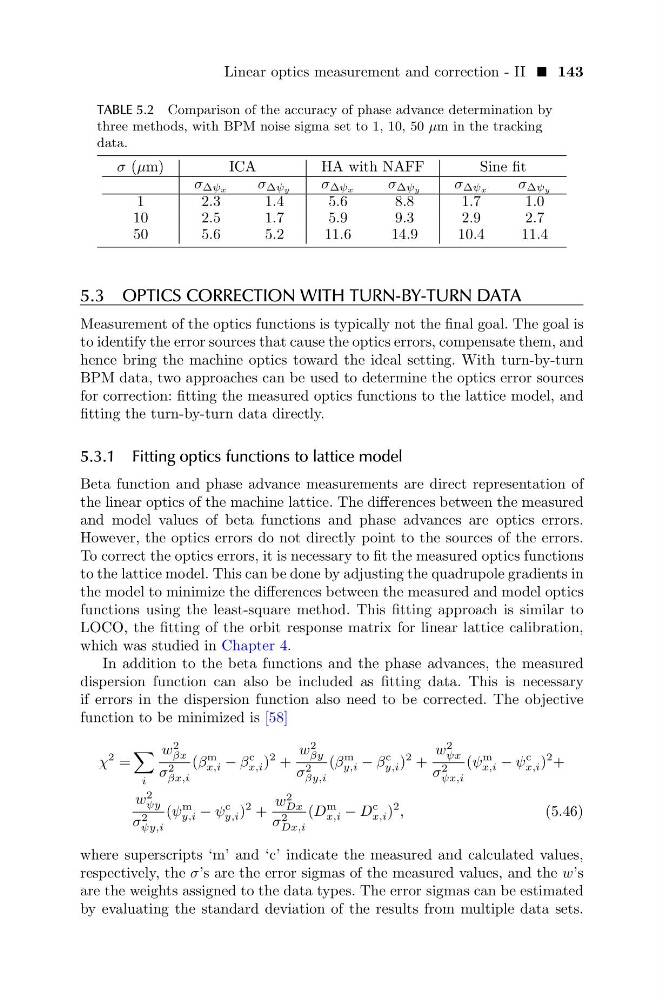
TABLE 5.2 Comparison of the accuracy of phase advance determination by
three methods, with BPM noise sigma set to 1, 10, 50 µm in the tracking
data.
σ (µm)
ICA
HA with NAFF
Sine fit
σ ∆ψx
σ ∆ψy
σ ∆ψx
σ ∆ψy
σ ∆ψx
σ ∆ψy
1
2.3
1.4
5.6
8.8
1.7
1.0
10
2.5
1.7
5.9
9.3
2.9
2.7
50
5.6
5.2
11.6
14.9
10.4
11.4
5.3 OPTICS CORRECTION WITH TURN-BY-TURN DATA
Measurement of the optics functions is typically not the final goal. The goal is
to identify the error sources that cause the optics errors, compensate them, and
hence bring the machine optics toward the ideal setting. With turn-by-turn
BPM data, two approaches can be used to determine the optics error sources
for correction: fitting the measured optics functions to the lattice model, and
fitting the turn-by-turn data directly.
5.3.1 Fitting optics functions to lattice model
Beta function and phase advance measurements are direct representation of
the linear optics of the machine lattice. The differences between the measured
and model values of beta functions and phase advances are optics errors.
However, the optics errors do not directly point to the sources of the errors.
To correct the optics errors, it is necessary to fit the measured optics functions
to the lattice model. This can be done by adjusting the quadrupole gradients in
the model to minimize the differences between the measured and model optics
functions using the least-square method. This fitting approach is similar to
LOCO, the fitting of the orbit response matrix for linear lattice calibration,
which was studied in Chapter 4.
In addition to the beta functions and the phase advances, the measured
dispersion function can also be included as fitting data. This is necessary
if errors in the dispersion function also need to be corrected. The objective
function to be minimized is [58]
χ
2 =
i
w
2
βx
σ 2
βx,i
(β
m
x,i − β
c
x,i )
2 +
w
2
βy
σ 2
βy,i
(β
m
y,i − β
c
y,i )
2 +
w
2
ψx
σ 2
ψx,i
(ψ
m
x,i − ψ
c
x,i )
2 +
w
2
ψy
σ 2
ψy,i
(ψ
m
y,i − ψ
c
y,i )
2 +
w
2
Dx
σ 2
Dx,i
(D
m
x,i − D
c
x,i )
2 ,
(5.46)
where superscripts ‘m’ and ‘c’ indicate the measured and calculated values,
respectively, the σ’s are the error sigmas of the measured values, and the w’s
are the weights assigned to the data types. The error sigmas can be estimated
by evaluating the standard deviation of the results from multiple data sets.
TABLE 5.2 Comparison of the accuracy of phase advance determination by
three methods, with BPM noise sigma set to 1, 10, 50 µm in the tracking
data.
σ (µm)
ICA
HA with NAFF
Sine fit
σ ∆ψx
σ ∆ψy
σ ∆ψx
σ ∆ψy
σ ∆ψx
σ ∆ψy
1
2.3
1.4
5.6
8.8
1.7
1.0
10
2.5
1.7
5.9
9.3
2.9
2.7
50
5.6
5.2
11.6
14.9
10.4
11.4
5.3 OPTICS CORRECTION WITH TURN-BY-TURN DATA
Measurement of the optics functions is typically not the final goal. The goal is
to identify the error sources that cause the optics errors, compensate them, and
hence bring the machine optics toward the ideal setting. With turn-by-turn
BPM data, two approaches can be used to determine the optics error sources
for correction: fitting the measured optics functions to the lattice model, and
fitting the turn-by-turn data directly.
5.3.1 Fitting optics functions to lattice model
Beta function and phase advance measurements are direct representation of
the linear optics of the machine lattice. The differences between the measured
and model values of beta functions and phase advances are optics errors.
However, the optics errors do not directly point to the sources of the errors.
To correct the optics errors, it is necessary to fit the measured optics functions
to the lattice model. This can be done by adjusting the quadrupole gradients in
the model to minimize the differences between the measured and model optics
functions using the least-square method. This fitting approach is similar to
LOCO, the fitting of the orbit response matrix for linear lattice calibration,
which was studied in Chapter 4.
In addition to the beta functions and the phase advances, the measured
dispersion function can also be included as fitting data. This is necessary
if errors in the dispersion function also need to be corrected. The objective
function to be minimized is [58]
χ
2 =
i
w
2
βx
σ 2
βx,i
(β
m
x,i − β
c
x,i )
2 +
w
2
βy
σ 2
βy,i
(β
m
y,i − β
c
y,i )
2 +
w
2
ψx
σ 2
ψx,i
(ψ
m
x,i − ψ
c
x,i )
2 +
w
2
ψy
σ 2
ψy,i
(ψ
m
y,i − ψ
c
y,i )
2 +
w
2
Dx
σ 2
Dx,i
(D
m
x,i − D
c
x,i )
2 ,
(5.46)
where superscripts ‘m’ and ‘c’ indicate the measured and calculated values,
respectively, the σ’s are the error sigmas of the measured values, and the w’s
are the weights assigned to the data types. The error sigmas can be estimated
by evaluating the standard deviation of the results from multiple data sets.