

Linear optics measurement and correction - I 97
(a)
x
x
′
n = 0
(b)
x
x
′
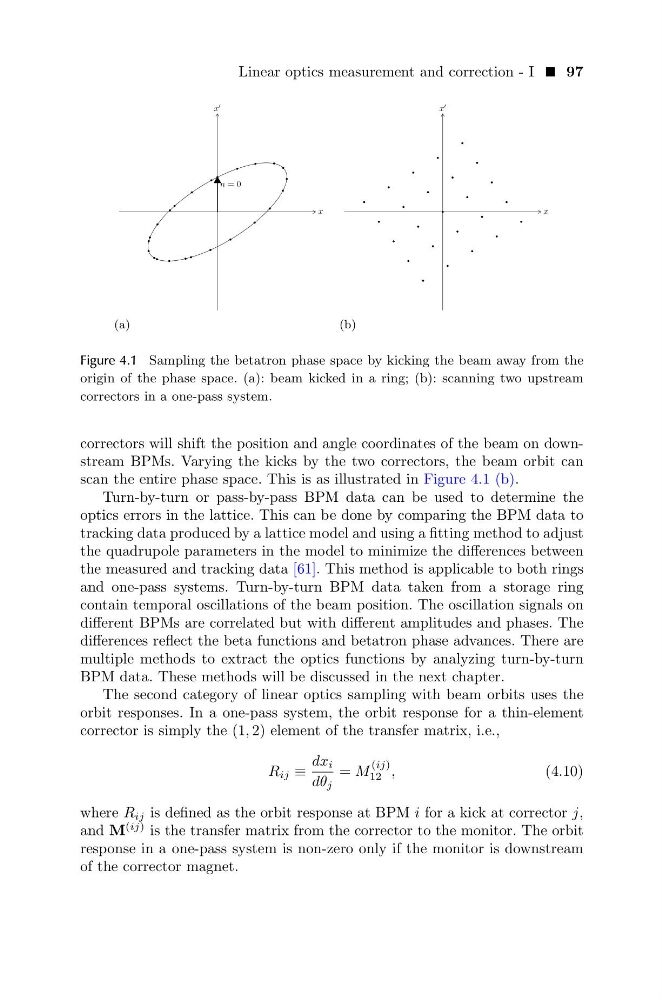
Figure 4.1 Sampling the betatron phase space by kicking the beam away from the
origin of the phase space. (a): beam kicked in a ring; (b): scanning two upstream
correctors in a one-pass system.
correctors will shift the position and angle coordinates of the beam on downstream BPMs. Varying the kicks by the two correctors, the beam orbit can
scan the entire phase space. This is as illustrated in Figure 4.1 (b).
Turn-by-turn or pass-by-pass BPM data can be used to determine the
optics errors in the lattice. This can be done by comparing the BPM data to
tracking data produced by a lattice model and using a fitting method to adjust
the quadrupole parameters in the model to minimize the differences between
the measured and tracking data [61]. This method is applicable to both rings
and one-pass systems. Turn-by-turn BPM data taken from a storage ring
contain temporal oscillations of the beam position. The oscillation signals on
different BPMs are correlated but with different amplitudes and phases. The
differences reflect the beta functions and betatron phase advances. There are
multiple methods to extract the optics functions by analyzing turn-by-turn
BPM data. These methods will be discussed in the next chapter.
The second category of linear optics sampling with beam orbits uses the
orbit responses. In a one-pass system, the orbit response for a thin-element
corrector is simply the (1, 2) element of the transfer matrix, i.e.,
R ij ≡
dx i
dθ j
= M
(ij)
12 ,
(4.10)
where R ij is defined as the orbit response at BPM i for a kick at corrector j,
and M
(ij) is the transfer matrix from the corrector to the monitor. The orbit
response in a one-pass system is non-zero only if the monitor is downstream
of the corrector magnet.
(a)
x
x
′
n = 0
(b)
x
x
′
Figure 4.1 Sampling the betatron phase space by kicking the beam away from the
origin of the phase space. (a): beam kicked in a ring; (b): scanning two upstream
correctors in a one-pass system.
correctors will shift the position and angle coordinates of the beam on downstream BPMs. Varying the kicks by the two correctors, the beam orbit can
scan the entire phase space. This is as illustrated in Figure 4.1 (b).
Turn-by-turn or pass-by-pass BPM data can be used to determine the
optics errors in the lattice. This can be done by comparing the BPM data to
tracking data produced by a lattice model and using a fitting method to adjust
the quadrupole parameters in the model to minimize the differences between
the measured and tracking data [61]. This method is applicable to both rings
and one-pass systems. Turn-by-turn BPM data taken from a storage ring
contain temporal oscillations of the beam position. The oscillation signals on
different BPMs are correlated but with different amplitudes and phases. The
differences reflect the beta functions and betatron phase advances. There are
multiple methods to extract the optics functions by analyzing turn-by-turn
BPM data. These methods will be discussed in the next chapter.
The second category of linear optics sampling with beam orbits uses the
orbit responses. In a one-pass system, the orbit response for a thin-element
corrector is simply the (1, 2) element of the transfer matrix, i.e.,
R ij ≡
dx i
dθ j
= M
(ij)
12 ,
(4.10)
where R ij is defined as the orbit response at BPM i for a kick at corrector j,
and M
(ij) is the transfer matrix from the corrector to the monitor. The orbit
response in a one-pass system is non-zero only if the monitor is downstream
of the corrector magnet.