

Top Curr Chem (Z) (2018) 376:24
1 3
For a given “population time” t 2 (also known as “waiting time”, and analogous to the time delay between the pump and the probe pulse in 1D pump–probe
[1D-PP] spectroscopy), a 2D spectrum (or map) is recorded as a function of
“excitation frequency” Ω 1 (Ω pump ) and “detection frequency” Ω 3 (Ω probe ) by Fourier transformation with respect to the t 1 and t 3 time intervals. Thus, the nonlinear spectral signatures of the GS are obtained by setting the time t 2 to zero,
while the state-specific response along excited-state dynamics can be monitored
for t 2 > 0.
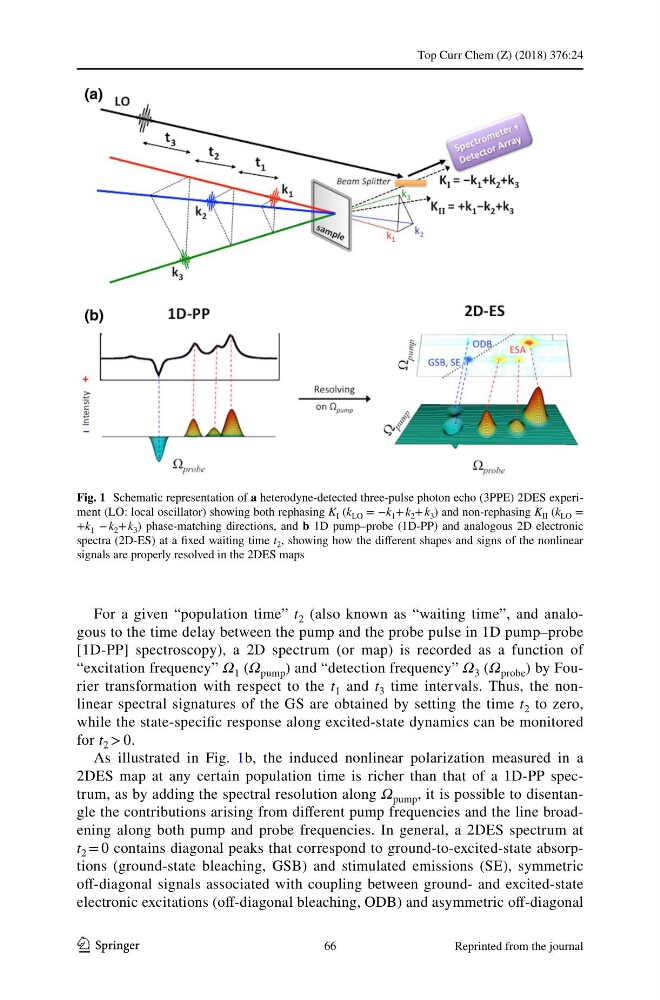
As illustrated in Fig. 1b, the induced nonlinear polarization measured in a
2DES map at any certain population time is richer than that of a 1D-PP spectrum, as by adding the spectral resolution along Ω pump , it is possible to disentangle the contributions arising from different pump frequencies and the line broadening along both pump and probe frequencies. In general, a 2DES spectrum at
t 2 = 0 contains diagonal peaks that correspond to ground-to-excited-state absorptions (ground-state bleaching, GSB) and stimulated emissions (SE), symmetric
off-diagonal signals associated with coupling between ground- and excited-state
electronic excitations (off-diagonal bleaching, ODB) and asymmetric off-diagonal
Fig. 1 Schematic representation of a heterodyne-detected three-pulse photon echo (3PPE) 2DES experiment (LO: local oscillator) showing both rephasing K I (k LO = −k 1 + k 2 + k 3 ) and non-rephasing K II (k LO =
+k 1 − k 2 + k 3 ) phase-matching directions, and b 1D pump–probe (1D-PP) and analogous 2D electronic
spectra (2D-ES) at a fixed waiting time t 2 , showing how the different shapes and signs of the nonlinear
signals are properly resolved in the 2DES maps
66
Reprinted from the journal
1 3
For a given “population time” t 2 (also known as “waiting time”, and analogous to the time delay between the pump and the probe pulse in 1D pump–probe
[1D-PP] spectroscopy), a 2D spectrum (or map) is recorded as a function of
“excitation frequency” Ω 1 (Ω pump ) and “detection frequency” Ω 3 (Ω probe ) by Fourier transformation with respect to the t 1 and t 3 time intervals. Thus, the nonlinear spectral signatures of the GS are obtained by setting the time t 2 to zero,
while the state-specific response along excited-state dynamics can be monitored
for t 2 > 0.
As illustrated in Fig. 1b, the induced nonlinear polarization measured in a
2DES map at any certain population time is richer than that of a 1D-PP spectrum, as by adding the spectral resolution along Ω pump , it is possible to disentangle the contributions arising from different pump frequencies and the line broadening along both pump and probe frequencies. In general, a 2DES spectrum at
t 2 = 0 contains diagonal peaks that correspond to ground-to-excited-state absorptions (ground-state bleaching, GSB) and stimulated emissions (SE), symmetric
off-diagonal signals associated with coupling between ground- and excited-state
electronic excitations (off-diagonal bleaching, ODB) and asymmetric off-diagonal
Fig. 1 Schematic representation of a heterodyne-detected three-pulse photon echo (3PPE) 2DES experiment (LO: local oscillator) showing both rephasing K I (k LO = −k 1 + k 2 + k 3 ) and non-rephasing K II (k LO =
+k 1 − k 2 + k 3 ) phase-matching directions, and b 1D pump–probe (1D-PP) and analogous 2D electronic
spectra (2D-ES) at a fixed waiting time t 2 , showing how the different shapes and signs of the nonlinear
signals are properly resolved in the 2DES maps
66
Reprinted from the journal