

1 3
Top Curr Chem (Z) (2018) 376:10
technique has enabled discoveries about the structure and dynamics of various photosynthetic light-harvesting complexes. A complete picture on how the energy transfer cascade evolves from the light harvesting antenna complex to the reaction center
has been recently shown in Fig. 9 for the photosynthetic apparatus of a green sulfur
bacterium [60]. This study was made possible due to 2DES developments, which
enable measurements in highly scattering environments as cells [60, 61], finally
allowing determination of the full transfer network between electronic transitions.
The steady-state spectrum of the apparatus (Fig. 9a) at 77 K reveals clear distinguishable features [48]: the high-energetic strongest band, which corresponds to the
assembly of light harvesting antenna complex (chlorosome), three absorption peaks
around 800 nm corresponding to the Fenna–Matthews–Olson (FMO) proteins that
mediate the energy transfer from the chlorosome to the reaction center (RC), which
shows a weak absorption band at the lowest energy (833 nm). The EET processes
have been extensively studied in the isolated photosynthetic FMO subunits [4, 5,
62] (Fig. 9b), and we show here the main interchromophoric EET pathways measured in the isolated FMO complex (Fig. 9b, c) [62]. The 2DES absorptive maps
reveal cross-peaks below and above the diagonal. While the cross-peak above the
diagonal do not exhibit any strong evolution, a clear signature of coupling among
T = 0 fs
T > 0 fs
Emission frequency (THz)
Excitation frequency (THz)
400
400
600
600
A
B
Emission frequency (THz)
Excitation frequency (THz)
400
400
600
600
A
B
AB
T = 0 fs
T > 0 fs
Emission frequency (THz)
Excitation frequency (THz)
400
400
600
600
Emission frequency (THz)
Excitation frequency (THz)
400
400
600
600
A
B
Weak Coupling
Strong Coupling
(excitonic)
A
B
A
B
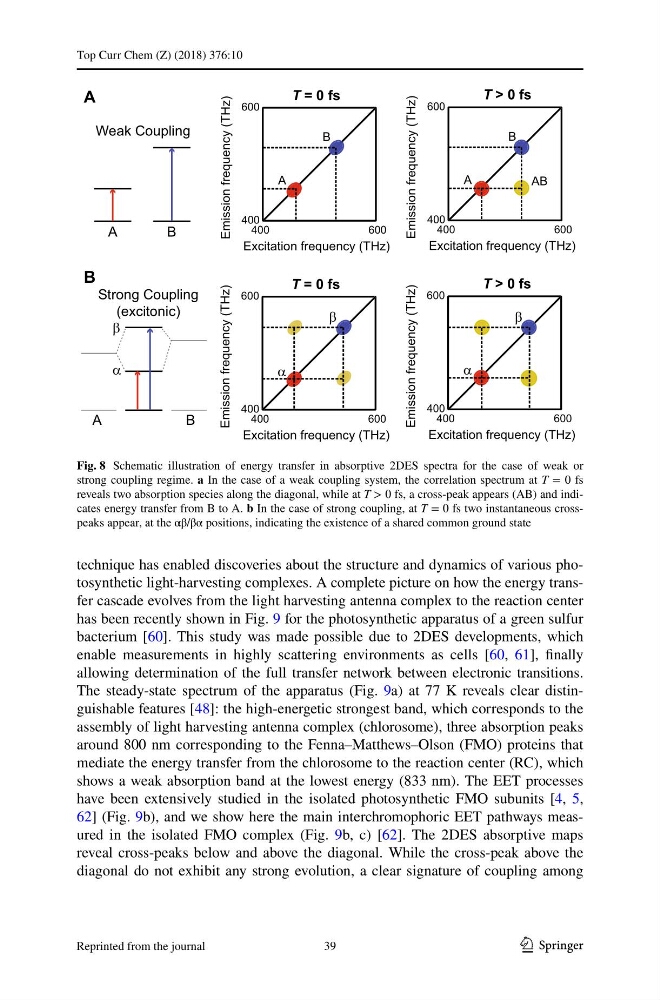
Fig. 8 Schematic illustration of energy transfer in absorptive 2DES spectra for the case of weak or
strong coupling regime. a In the case of a weak coupling system, the correlation spectrum at T = 0 fs
reveals two absorption species along the diagonal, while at T > 0 fs, a cross-peak appears (AB) and indicates energy transfer from B to A. b In the case of strong coupling, at T = 0 fs two instantaneous crosspeaks appear, at the αβ/βα positions, indicating the existence of a shared common ground state
39
Reprinted from the journal
Top Curr Chem (Z) (2018) 376:10
technique has enabled discoveries about the structure and dynamics of various photosynthetic light-harvesting complexes. A complete picture on how the energy transfer cascade evolves from the light harvesting antenna complex to the reaction center
has been recently shown in Fig. 9 for the photosynthetic apparatus of a green sulfur
bacterium [60]. This study was made possible due to 2DES developments, which
enable measurements in highly scattering environments as cells [60, 61], finally
allowing determination of the full transfer network between electronic transitions.
The steady-state spectrum of the apparatus (Fig. 9a) at 77 K reveals clear distinguishable features [48]: the high-energetic strongest band, which corresponds to the
assembly of light harvesting antenna complex (chlorosome), three absorption peaks
around 800 nm corresponding to the Fenna–Matthews–Olson (FMO) proteins that
mediate the energy transfer from the chlorosome to the reaction center (RC), which
shows a weak absorption band at the lowest energy (833 nm). The EET processes
have been extensively studied in the isolated photosynthetic FMO subunits [4, 5,
62] (Fig. 9b), and we show here the main interchromophoric EET pathways measured in the isolated FMO complex (Fig. 9b, c) [62]. The 2DES absorptive maps
reveal cross-peaks below and above the diagonal. While the cross-peak above the
diagonal do not exhibit any strong evolution, a clear signature of coupling among
T = 0 fs
T > 0 fs
Emission frequency (THz)
Excitation frequency (THz)
400
400
600
600
A
B
Emission frequency (THz)
Excitation frequency (THz)
400
400
600
600
A
B
AB
T = 0 fs
T > 0 fs
Emission frequency (THz)
Excitation frequency (THz)
400
400
600
600
Emission frequency (THz)
Excitation frequency (THz)
400
400
600
600
A
B
Weak Coupling
Strong Coupling
(excitonic)
A
B
A
B
Fig. 8 Schematic illustration of energy transfer in absorptive 2DES spectra for the case of weak or
strong coupling regime. a In the case of a weak coupling system, the correlation spectrum at T = 0 fs
reveals two absorption species along the diagonal, while at T > 0 fs, a cross-peak appears (AB) and indicates energy transfer from B to A. b In the case of strong coupling, at T = 0 fs two instantaneous crosspeaks appear, at the αβ/βα positions, indicating the existence of a shared common ground state
39
Reprinted from the journal