

1 3
Top Curr Chem (Z) (2018) 376:10
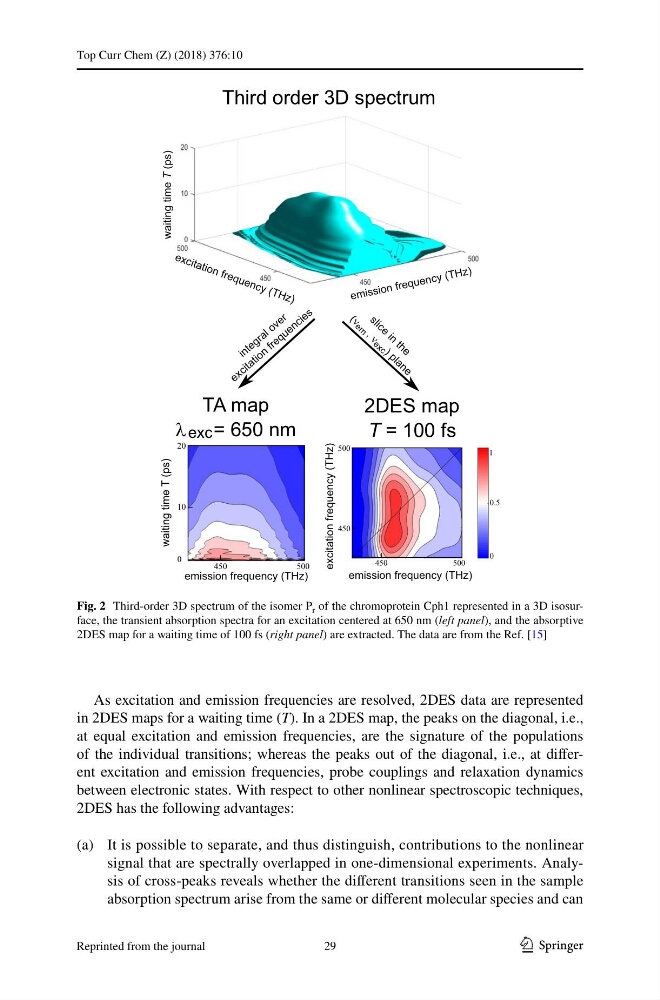
As excitation and emission frequencies are resolved, 2DES data are represented
in 2DES maps for a waiting time (T). In a 2DES map, the peaks on the diagonal, i.e.,
at equal excitation and emission frequencies, are the signature of the populations
of the individual transitions; whereas the peaks out of the diagonal, i.e., at different excitation and emission frequencies, probe couplings and relaxation dynamics
between electronic states. With respect to other nonlinear spectroscopic techniques,
2DES has the following advantages:
(a) It is possible to separate, and thus distinguish, contributions to the nonlinear
signal that are spectrally overlapped in one-dimensional experiments. Analysis of cross-peaks reveals whether the different transitions seen in the sample
absorption spectrum arise from the same or different molecular species and can
2DES map
T = 100 fs
TA map
λ = 650 nm
exc
waiting time T (ps)
emission frequency (THz)
450
500
0
10
20
excitation frequency (THz)
emission frequency (THz)
0
450
500
450
500
0.5
1
i n t e g r a l o v e r
e x c i t a t i o n
f r e q u e n c i e s
s l i c e i n t h e
( ν
, ν
) p l a n e
e m
e x c
waiting time T (ps)
em is si on fre qu en cy (T H z)
e x c it a ti o n fr e q u e n c y (T H z )
Third order 3D spectrum
Fig. 2 Third-order 3D spectrum of the isomer P r of the chromoprotein Cph1 represented in a 3D isosurface, the transient absorption spectra for an excitation centered at 650 nm (left panel), and the absorptive
2DES map for a waiting time of 100 fs (right panel) are extracted. The data are from the Ref. [15]
29
Reprinted from the journal
Top Curr Chem (Z) (2018) 376:10
As excitation and emission frequencies are resolved, 2DES data are represented
in 2DES maps for a waiting time (T). In a 2DES map, the peaks on the diagonal, i.e.,
at equal excitation and emission frequencies, are the signature of the populations
of the individual transitions; whereas the peaks out of the diagonal, i.e., at different excitation and emission frequencies, probe couplings and relaxation dynamics
between electronic states. With respect to other nonlinear spectroscopic techniques,
2DES has the following advantages:
(a) It is possible to separate, and thus distinguish, contributions to the nonlinear
signal that are spectrally overlapped in one-dimensional experiments. Analysis of cross-peaks reveals whether the different transitions seen in the sample
absorption spectrum arise from the same or different molecular species and can
2DES map
T = 100 fs
TA map
λ = 650 nm
exc
waiting time T (ps)
emission frequency (THz)
450
500
0
10
20
excitation frequency (THz)
emission frequency (THz)
0
450
500
450
500
0.5
1
i n t e g r a l o v e r
e x c i t a t i o n
f r e q u e n c i e s
s l i c e i n t h e
( ν
, ν
) p l a n e
e m
e x c
waiting time T (ps)
em is si on fre qu en cy (T H z)
e x c it a ti o n fr e q u e n c y (T H z )
Third order 3D spectrum
Fig. 2 Third-order 3D spectrum of the isomer P r of the chromoprotein Cph1 represented in a 3D isosurface, the transient absorption spectra for an excitation centered at 650 nm (left panel), and the absorptive
2DES map for a waiting time of 100 fs (right panel) are extracted. The data are from the Ref. [15]
29
Reprinted from the journal