

In our initial efforts, we ruled out cascaded signals with control experiments
based on the signal phases, concentration dependence, and variation of the beam
geometry [22, 24]. Our model calculations suggest that cascades dominate offresonant experiments because the 2D Raman and cascaded responses are
respectively forbidden and allowed for harmonic systems (i.e., they are subject to
different selection rules). Of course, this is also why off-resonant 2D Raman
experiments are useful for investigating anharmonicity in pure liquids [20]. The
problem is that the cascaded signal is more intense because it relies on lower-order
terms in the potential energy and/or polarizability. Tuning laser pulses into
electronic resonance obviates such selection rules. Vibrational modes contribute to
the 2DRR signals if they are Franck–Condon active (i.e., whether they are harmonic
or not). Moreover, the 2DRR signal intensity is larger than that associated with
cascades because cascades involve two more field-matter interactions (i.e., the
cascade is higher-order in this sense). This can be proven by summing the
interactions in Fig. 6.
While 2DRR spectroscopy is less susceptible to cascades than is off-resonant 2D
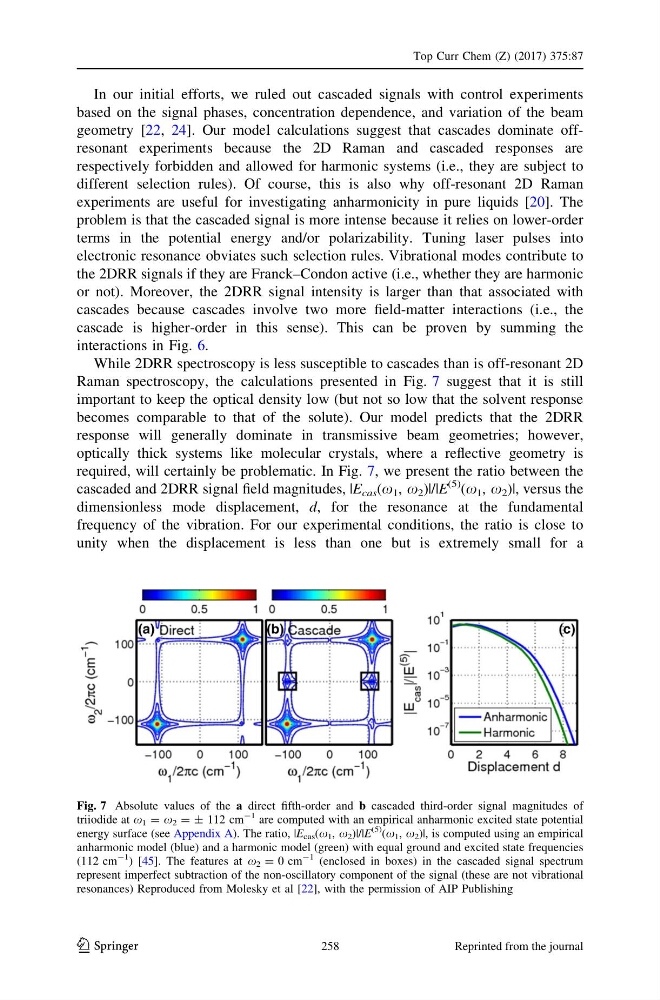
Raman spectroscopy, the calculations presented in Fig. 7 suggest that it is still
important to keep the optical density low (but not so low that the solvent response
becomes comparable to that of the solute). Our model predicts that the 2DRR
response will generally dominate in transmissive beam geometries; however,
optically thick systems like molecular crystals, where a reflective geometry is
required, will certainly be problematic. In Fig. 7, we present the ratio between the
cascaded and 2DRR signal field magnitudes, |E cas (x 1 , x 2 )|/|E
(5) (x 1 , x 2 )|, versus the
dimensionless mode displacement, d, for the resonance at the fundamental
frequency of the vibration. For our experimental conditions, the ratio is close to
unity when the displacement is less than one but is extremely small for a
Fig. 7 Absolute values of the a direct fifth-order and b cascaded third-order signal magnitudes of
triiodide at x 1 = x 2 = ± 112 cm
-1 are computed with an empirical anharmonic excited state potential
energy surface (see Appendix A). The ratio, |E cas (x 1 , x 2 )|/|E
(5)
(x 1 , x 2 )|, is computed using an empirical
anharmonic model (blue) and a harmonic model (green) with equal ground and excited state frequencies
(112 cm
-1 ) [45]. The features at x 2 = 0 cm
-1 (enclosed in boxes) in the cascaded signal spectrum
represent imperfect subtraction of the non-oscillatory component of the signal (these are not vibrational
resonances) Reproduced from Molesky et al [22], with the permission of AIP Publishing
Top Curr Chem (Z) (2017) 375:87
123
258
Reprinted from the journal
based on the signal phases, concentration dependence, and variation of the beam
geometry [22, 24]. Our model calculations suggest that cascades dominate offresonant experiments because the 2D Raman and cascaded responses are
respectively forbidden and allowed for harmonic systems (i.e., they are subject to
different selection rules). Of course, this is also why off-resonant 2D Raman
experiments are useful for investigating anharmonicity in pure liquids [20]. The
problem is that the cascaded signal is more intense because it relies on lower-order
terms in the potential energy and/or polarizability. Tuning laser pulses into
electronic resonance obviates such selection rules. Vibrational modes contribute to
the 2DRR signals if they are Franck–Condon active (i.e., whether they are harmonic
or not). Moreover, the 2DRR signal intensity is larger than that associated with
cascades because cascades involve two more field-matter interactions (i.e., the
cascade is higher-order in this sense). This can be proven by summing the
interactions in Fig. 6.
While 2DRR spectroscopy is less susceptible to cascades than is off-resonant 2D
Raman spectroscopy, the calculations presented in Fig. 7 suggest that it is still
important to keep the optical density low (but not so low that the solvent response
becomes comparable to that of the solute). Our model predicts that the 2DRR
response will generally dominate in transmissive beam geometries; however,
optically thick systems like molecular crystals, where a reflective geometry is
required, will certainly be problematic. In Fig. 7, we present the ratio between the
cascaded and 2DRR signal field magnitudes, |E cas (x 1 , x 2 )|/|E
(5) (x 1 , x 2 )|, versus the
dimensionless mode displacement, d, for the resonance at the fundamental
frequency of the vibration. For our experimental conditions, the ratio is close to
unity when the displacement is less than one but is extremely small for a
Fig. 7 Absolute values of the a direct fifth-order and b cascaded third-order signal magnitudes of
triiodide at x 1 = x 2 = ± 112 cm
-1 are computed with an empirical anharmonic excited state potential
energy surface (see Appendix A). The ratio, |E cas (x 1 , x 2 )|/|E
(5)
(x 1 , x 2 )|, is computed using an empirical
anharmonic model (blue) and a harmonic model (green) with equal ground and excited state frequencies
(112 cm
-1 ) [45]. The features at x 2 = 0 cm
-1 (enclosed in boxes) in the cascaded signal spectrum
represent imperfect subtraction of the non-oscillatory component of the signal (these are not vibrational
resonances) Reproduced from Molesky et al [22], with the permission of AIP Publishing
Top Curr Chem (Z) (2017) 375:87
123
258
Reprinted from the journal