

5.1 Technical Applications and Advanced Data Acquisition
Most of the reported 2D IR measurements for samples in bulk solution
environments are performed with sample flow cells, where a stationary spot of a
cuvette is continuously irradiated, the sample is refreshed from shot to shot, and the
composition of the sample solution is taken to be isotropic during the entire
measurement and averaging time. There exist a couple of experimental situations in
which such conditions are not or cannot be met, but where 2D IR spectroscopy
would still be very helpful for elucidating dynamics or chemical reactions and
interactions between sample constituents. A good example for such a situation is the
flow of chemical mixtures in a microfluidic channel. Very recently, this type of
application for 2D IR spectroscopy has been demonstrated by Krummel et al. in a
study where the authors designed a microfluidic sample cell in conjunction with a
high-repetition rate laser system (100 kHz) for measuring 2D IR signals from
samples of non-uniform chemical constitution [288]. In that study the ultrafast
vibrational dynamics of the OCN
- anion in different chemical environments has
been investigated as a good model system since the employed solvent-ratio has a
profound impact on its vibrational properties. A specific microfluidic channel was
designed to create lateral concentration gradients of dimethylformamide/methanol
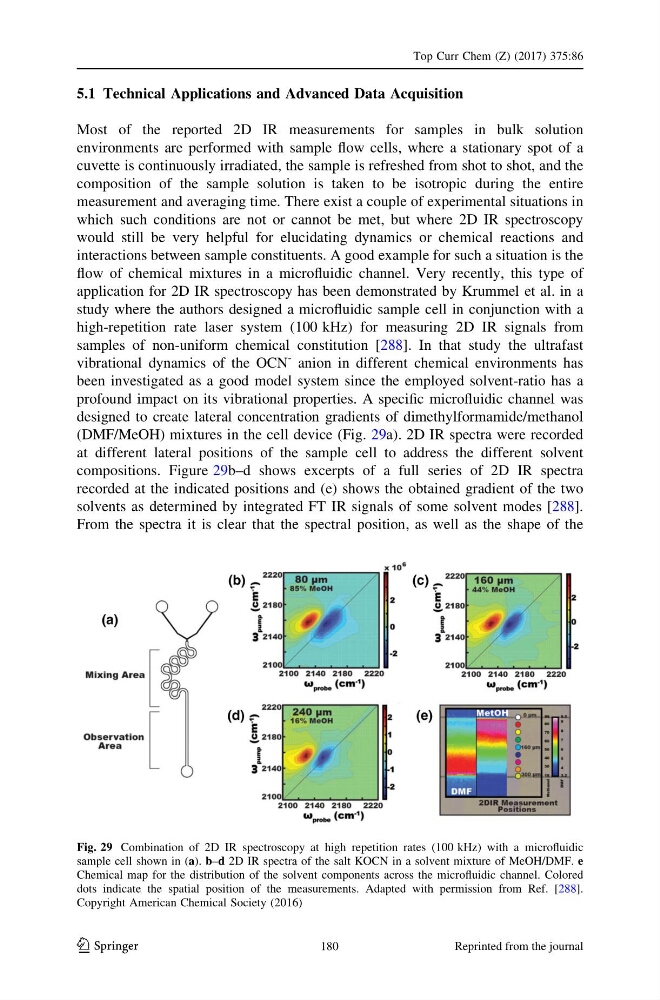
(DMF/MeOH) mixtures in the cell device (Fig. 29a). 2D IR spectra were recorded
at different lateral positions of the sample cell to address the different solvent
compositions. Figure 29b–d shows excerpts of a full series of 2D IR spectra
recorded at the indicated positions and (e) shows the obtained gradient of the two
solvents as determined by integrated FT IR signals of some solvent modes [288].
From the spectra it is clear that the spectral position, as well as the shape of the
Fig. 29 Combination of 2D IR spectroscopy at high repetition rates (100 kHz) with a microfluidic
sample cell shown in (a). b–d 2D IR spectra of the salt KOCN in a solvent mixture of MeOH/DMF. e
Chemical map for the distribution of the solvent components across the microfluidic channel. Colored
dots indicate the spatial position of the measurements. Adapted with permission from Ref. [288].
Copyright American Chemical Society (2016)
Top Curr Chem (Z) (2017) 375:86
123
180
Reprinted from the journal
Most of the reported 2D IR measurements for samples in bulk solution
environments are performed with sample flow cells, where a stationary spot of a
cuvette is continuously irradiated, the sample is refreshed from shot to shot, and the
composition of the sample solution is taken to be isotropic during the entire
measurement and averaging time. There exist a couple of experimental situations in
which such conditions are not or cannot be met, but where 2D IR spectroscopy
would still be very helpful for elucidating dynamics or chemical reactions and
interactions between sample constituents. A good example for such a situation is the
flow of chemical mixtures in a microfluidic channel. Very recently, this type of
application for 2D IR spectroscopy has been demonstrated by Krummel et al. in a
study where the authors designed a microfluidic sample cell in conjunction with a
high-repetition rate laser system (100 kHz) for measuring 2D IR signals from
samples of non-uniform chemical constitution [288]. In that study the ultrafast
vibrational dynamics of the OCN
- anion in different chemical environments has
been investigated as a good model system since the employed solvent-ratio has a
profound impact on its vibrational properties. A specific microfluidic channel was
designed to create lateral concentration gradients of dimethylformamide/methanol
(DMF/MeOH) mixtures in the cell device (Fig. 29a). 2D IR spectra were recorded
at different lateral positions of the sample cell to address the different solvent
compositions. Figure 29b–d shows excerpts of a full series of 2D IR spectra
recorded at the indicated positions and (e) shows the obtained gradient of the two
solvents as determined by integrated FT IR signals of some solvent modes [288].
From the spectra it is clear that the spectral position, as well as the shape of the
Fig. 29 Combination of 2D IR spectroscopy at high repetition rates (100 kHz) with a microfluidic
sample cell shown in (a). b–d 2D IR spectra of the salt KOCN in a solvent mixture of MeOH/DMF. e
Chemical map for the distribution of the solvent components across the microfluidic channel. Colored
dots indicate the spatial position of the measurements. Adapted with permission from Ref. [288].
Copyright American Chemical Society (2016)
Top Curr Chem (Z) (2017) 375:86
123
180
Reprinted from the journal