

Theoretical and experimental investigations have been used to elucidate how the
spectral correlations can be related to the solvation correlation function for certain
vibrations [282].
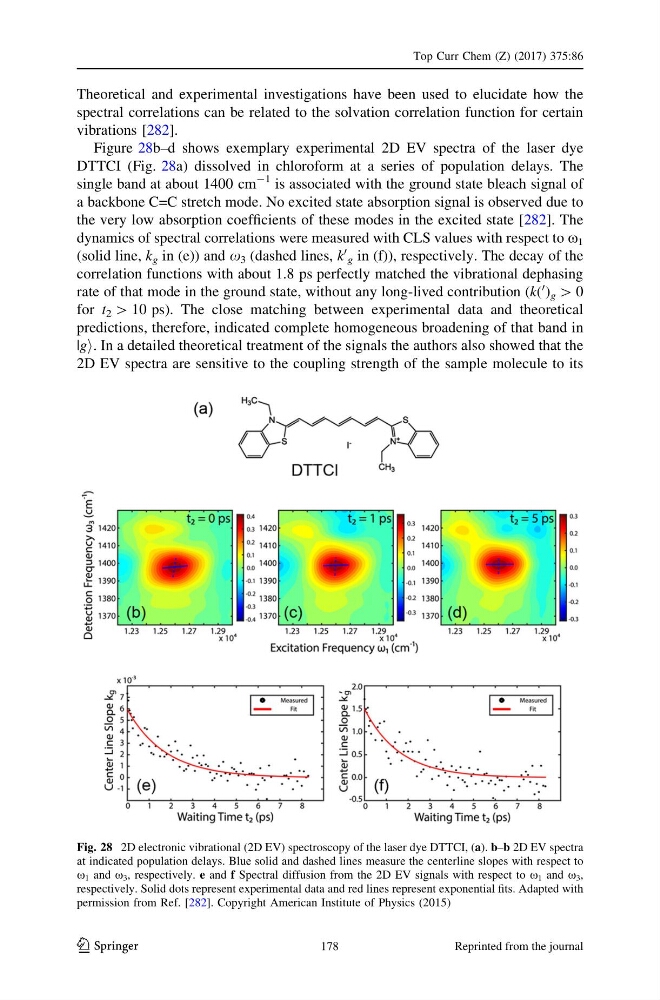
Figure 28b–d shows exemplary experimental 2D EV spectra of the laser dye
DTTCI (Fig. 28a) dissolved in chloroform at a series of population delays. The
single band at about 1400 cm
-1 is associated with the ground state bleach signal of
a backbone C=C stretch mode. No excited state absorption signal is observed due to
the very low absorption coefficients of these modes in the excited state [282]. The
dynamics of spectral correlations were measured with CLS values with respect to x 1
(solid line, k g in (e)) and x 3 (dashed lines, k
0
g in (f)), respectively. The decay of the
correlation functions with about 1.8 ps perfectly matched the vibrational dephasing
rate of that mode in the ground state, without any long-lived contribution (k(
0 ) g [ 0
for t 2 [ 10 ps). The close matching between experimental data and theoretical
predictions, therefore, indicated complete homogeneous broadening of that band in
|gi. In a detailed theoretical treatment of the signals the authors also showed that the
2D EV spectra are sensitive to the coupling strength of the sample molecule to its
Fig. 28 2D electronic vibrational (2D EV) spectroscopy of the laser dye DTTCI, (a). b–b 2D EV spectra
at indicated population delays. Blue solid and dashed lines measure the centerline slopes with respect to
x 1 and x 3 , respectively. e and f Spectral diffusion from the 2D EV signals with respect to x 1 and x 3 ,
respectively. Solid dots represent experimental data and red lines represent exponential fits. Adapted with
permission from Ref. [282]. Copyright American Institute of Physics (2015)
Top Curr Chem (Z) (2017) 375:86
123
178
Reprinted from the journal
spectral correlations can be related to the solvation correlation function for certain
vibrations [282].
Figure 28b–d shows exemplary experimental 2D EV spectra of the laser dye
DTTCI (Fig. 28a) dissolved in chloroform at a series of population delays. The
single band at about 1400 cm
-1 is associated with the ground state bleach signal of
a backbone C=C stretch mode. No excited state absorption signal is observed due to
the very low absorption coefficients of these modes in the excited state [282]. The
dynamics of spectral correlations were measured with CLS values with respect to x 1
(solid line, k g in (e)) and x 3 (dashed lines, k
0
g in (f)), respectively. The decay of the
correlation functions with about 1.8 ps perfectly matched the vibrational dephasing
rate of that mode in the ground state, without any long-lived contribution (k(
0 ) g [ 0
for t 2 [ 10 ps). The close matching between experimental data and theoretical
predictions, therefore, indicated complete homogeneous broadening of that band in
|gi. In a detailed theoretical treatment of the signals the authors also showed that the
2D EV spectra are sensitive to the coupling strength of the sample molecule to its
Fig. 28 2D electronic vibrational (2D EV) spectroscopy of the laser dye DTTCI, (a). b–b 2D EV spectra
at indicated population delays. Blue solid and dashed lines measure the centerline slopes with respect to
x 1 and x 3 , respectively. e and f Spectral diffusion from the 2D EV signals with respect to x 1 and x 3 ,
respectively. Solid dots represent experimental data and red lines represent exponential fits. Adapted with
permission from Ref. [282]. Copyright American Institute of Physics (2015)
Top Curr Chem (Z) (2017) 375:86
123
178
Reprinted from the journal