

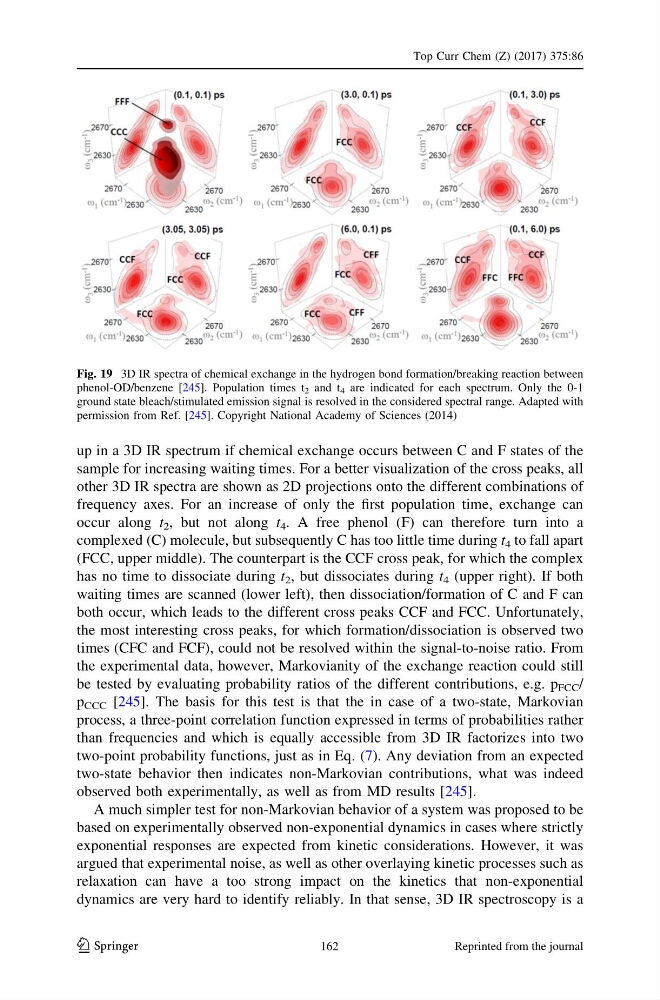
up in a 3D IR spectrum if chemical exchange occurs between C and F states of the
sample for increasing waiting times. For a better visualization of the cross peaks, all
other 3D IR spectra are shown as 2D projections onto the different combinations of
frequency axes. For an increase of only the first population time, exchange can
occur along t 2 , but not along t 4 . A free phenol (F) can therefore turn into a
complexed (C) molecule, but subsequently C has too little time during t 4 to fall apart
(FCC, upper middle). The counterpart is the CCF cross peak, for which the complex
has no time to dissociate during t 2 , but dissociates during t 4 (upper right). If both
waiting times are scanned (lower left), then dissociation/formation of C and F can
both occur, which leads to the different cross peaks CCF and FCC. Unfortunately,
the most interesting cross peaks, for which formation/dissociation is observed two
times (CFC and FCF), could not be resolved within the signal-to-noise ratio. From
the experimental data, however, Markovianity of the exchange reaction could still
be tested by evaluating probability ratios of the different contributions, e.g. p FCC /
p CCC [245]. The basis for this test is that the in case of a two-state, Markovian
process, a three-point correlation function expressed in terms of probabilities rather
than frequencies and which is equally accessible from 3D IR factorizes into two
two-point probability functions, just as in Eq. (7). Any deviation from an expected
two-state behavior then indicates non-Markovian contributions, what was indeed
observed both experimentally, as well as from MD results [245].
A much simpler test for non-Markovian behavior of a system was proposed to be
based on experimentally observed non-exponential dynamics in cases where strictly
exponential responses are expected from kinetic considerations. However, it was
argued that experimental noise, as well as other overlaying kinetic processes such as
relaxation can have a too strong impact on the kinetics that non-exponential
dynamics are very hard to identify reliably. In that sense, 3D IR spectroscopy is a
Fig. 19 3D IR spectra of chemical exchange in the hydrogen bond formation/breaking reaction between
phenol-OD/benzene [245]. Population times t 2 and t 4 are indicated for each spectrum. Only the 0-1
ground state bleach/stimulated emission signal is resolved in the considered spectral range. Adapted with
permission from Ref. [245]. Copyright National Academy of Sciences (2014)
Top Curr Chem (Z) (2017) 375:86
123
162
Reprinted from the journal
sample for increasing waiting times. For a better visualization of the cross peaks, all
other 3D IR spectra are shown as 2D projections onto the different combinations of
frequency axes. For an increase of only the first population time, exchange can
occur along t 2 , but not along t 4 . A free phenol (F) can therefore turn into a
complexed (C) molecule, but subsequently C has too little time during t 4 to fall apart
(FCC, upper middle). The counterpart is the CCF cross peak, for which the complex
has no time to dissociate during t 2 , but dissociates during t 4 (upper right). If both
waiting times are scanned (lower left), then dissociation/formation of C and F can
both occur, which leads to the different cross peaks CCF and FCC. Unfortunately,
the most interesting cross peaks, for which formation/dissociation is observed two
times (CFC and FCF), could not be resolved within the signal-to-noise ratio. From
the experimental data, however, Markovianity of the exchange reaction could still
be tested by evaluating probability ratios of the different contributions, e.g. p FCC /
p CCC [245]. The basis for this test is that the in case of a two-state, Markovian
process, a three-point correlation function expressed in terms of probabilities rather
than frequencies and which is equally accessible from 3D IR factorizes into two
two-point probability functions, just as in Eq. (7). Any deviation from an expected
two-state behavior then indicates non-Markovian contributions, what was indeed
observed both experimentally, as well as from MD results [245].
A much simpler test for non-Markovian behavior of a system was proposed to be
based on experimentally observed non-exponential dynamics in cases where strictly
exponential responses are expected from kinetic considerations. However, it was
argued that experimental noise, as well as other overlaying kinetic processes such as
relaxation can have a too strong impact on the kinetics that non-exponential
dynamics are very hard to identify reliably. In that sense, 3D IR spectroscopy is a
Fig. 19 3D IR spectra of chemical exchange in the hydrogen bond formation/breaking reaction between
phenol-OD/benzene [245]. Population times t 2 and t 4 are indicated for each spectrum. Only the 0-1
ground state bleach/stimulated emission signal is resolved in the considered spectral range. Adapted with
permission from Ref. [245]. Copyright National Academy of Sciences (2014)
Top Curr Chem (Z) (2017) 375:86
123
162
Reprinted from the journal