

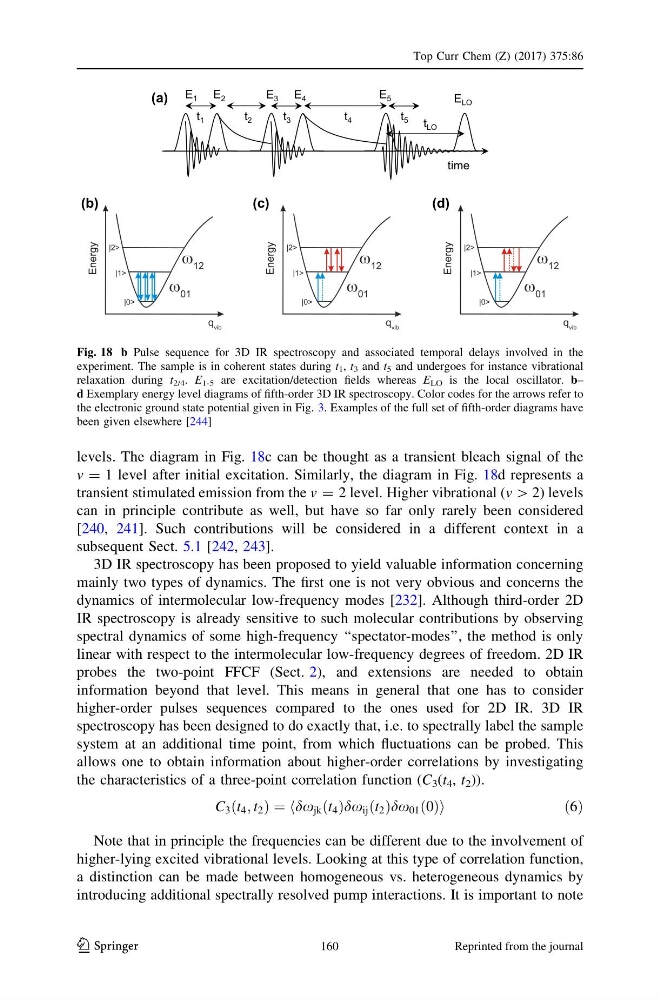
levels. The diagram in Fig. 18c can be thought as a transient bleach signal of the
v = 1 level after initial excitation. Similarly, the diagram in Fig. 18d represents a
transient stimulated emission from the v = 2 level. Higher vibrational (v [ 2) levels
can in principle contribute as well, but have so far only rarely been considered
[240, 241]. Such contributions will be considered in a different context in a
subsequent Sect. 5.1 [242, 243].
3D IR spectroscopy has been proposed to yield valuable information concerning
mainly two types of dynamics. The first one is not very obvious and concerns the
dynamics of intermolecular low-frequency modes [232]. Although third-order 2D
IR spectroscopy is already sensitive to such molecular contributions by observing
spectral dynamics of some high-frequency ‘‘spectator-modes’’, the method is only
linear with respect to the intermolecular low-frequency degrees of freedom. 2D IR
probes the two-point FFCF (Sect. 2), and extensions are needed to obtain
information beyond that level. This means in general that one has to consider
higher-order pulses sequences compared to the ones used for 2D IR. 3D IR
spectroscopy has been designed to do exactly that, i.e. to spectrally label the sample
system at an additional time point, from which fluctuations can be probed. This
allows one to obtain information about higher-order correlations by investigating
the characteristics of a three-point correlation function (C 3 (t 4 , t 2 )).
C 3 t 4 ; t 2
ð
Þ¼ hdx jk t 4
ð Þdx ij t 2
ð Þdx 01 0
ð Þi
ð6Þ
Note that in principle the frequencies can be different due to the involvement of
higher-lying excited vibrational levels. Looking at this type of correlation function,
a distinction can be made between homogeneous vs. heterogeneous dynamics by
introducing additional spectrally resolved pump interactions. It is important to note
E 1 E 2
E 5
time
E LO
t 1
t 2
t LO
t 3
t 4
E 3 E 4
t 5
(a)
(b)
(c)
(d)
Fig. 18 b Pulse sequence for 3D IR spectroscopy and associated temporal delays involved in the
experiment. The sample is in coherent states during t 1 , t 3 and t 5 and undergoes for instance vibrational
relaxation during t 2/4 . E 1-5 are excitation/detection fields whereas E LO is the local oscillator. b–
d Exemplary energy level diagrams of fifth-order 3D IR spectroscopy. Color codes for the arrows refer to
the electronic ground state potential given in Fig. 3. Examples of the full set of fifth-order diagrams have
been given elsewhere [244]
Top Curr Chem (Z) (2017) 375:86
123
160
Reprinted from the journal
v = 1 level after initial excitation. Similarly, the diagram in Fig. 18d represents a
transient stimulated emission from the v = 2 level. Higher vibrational (v [ 2) levels
can in principle contribute as well, but have so far only rarely been considered
[240, 241]. Such contributions will be considered in a different context in a
subsequent Sect. 5.1 [242, 243].
3D IR spectroscopy has been proposed to yield valuable information concerning
mainly two types of dynamics. The first one is not very obvious and concerns the
dynamics of intermolecular low-frequency modes [232]. Although third-order 2D
IR spectroscopy is already sensitive to such molecular contributions by observing
spectral dynamics of some high-frequency ‘‘spectator-modes’’, the method is only
linear with respect to the intermolecular low-frequency degrees of freedom. 2D IR
probes the two-point FFCF (Sect. 2), and extensions are needed to obtain
information beyond that level. This means in general that one has to consider
higher-order pulses sequences compared to the ones used for 2D IR. 3D IR
spectroscopy has been designed to do exactly that, i.e. to spectrally label the sample
system at an additional time point, from which fluctuations can be probed. This
allows one to obtain information about higher-order correlations by investigating
the characteristics of a three-point correlation function (C 3 (t 4 , t 2 )).
C 3 t 4 ; t 2
ð
Þ¼ hdx jk t 4
ð Þdx ij t 2
ð Þdx 01 0
ð Þi
ð6Þ
Note that in principle the frequencies can be different due to the involvement of
higher-lying excited vibrational levels. Looking at this type of correlation function,
a distinction can be made between homogeneous vs. heterogeneous dynamics by
introducing additional spectrally resolved pump interactions. It is important to note
E 1 E 2
E 5
time
E LO
t 1
t 2
t LO
t 3
t 4
E 3 E 4
t 5
(a)
(b)
(c)
(d)
Fig. 18 b Pulse sequence for 3D IR spectroscopy and associated temporal delays involved in the
experiment. The sample is in coherent states during t 1 , t 3 and t 5 and undergoes for instance vibrational
relaxation during t 2/4 . E 1-5 are excitation/detection fields whereas E LO is the local oscillator. b–
d Exemplary energy level diagrams of fifth-order 3D IR spectroscopy. Color codes for the arrows refer to
the electronic ground state potential given in Fig. 3. Examples of the full set of fifth-order diagrams have
been given elsewhere [244]
Top Curr Chem (Z) (2017) 375:86
123
160
Reprinted from the journal