

that have been
13 C
18 O isotope-labeled to obtain residue-specific structural
information and to break the vibrational coupling of the amide-I modes along the
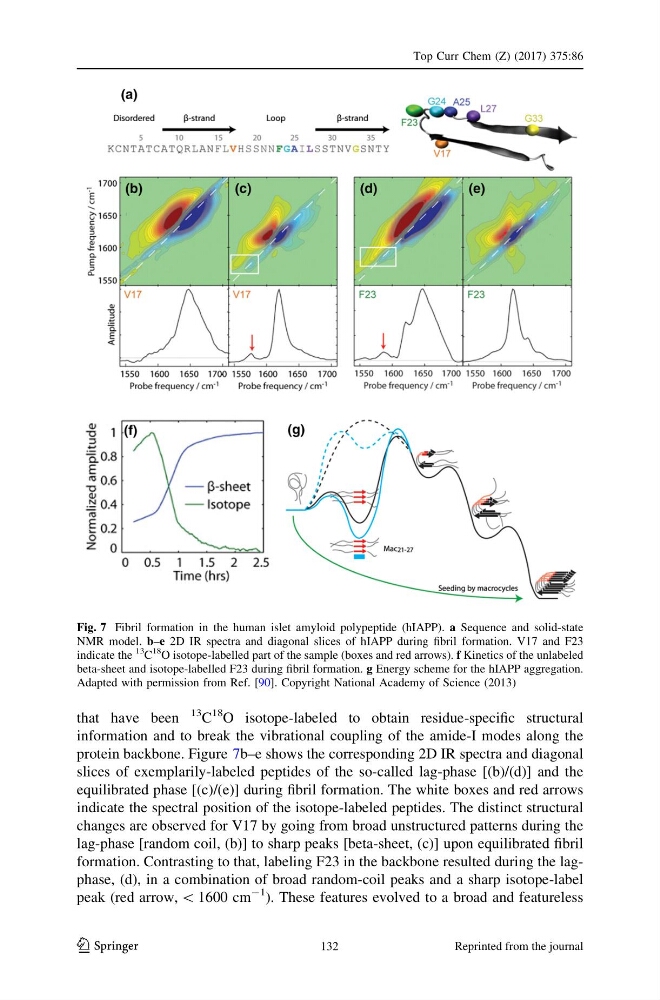
protein backbone. Figure 7b–e shows the corresponding 2D IR spectra and diagonal
slices of exemplarily-labeled peptides of the so-called lag-phase [(b)/(d)] and the
equilibrated phase [(c)/(e)] during fibril formation. The white boxes and red arrows
indicate the spectral position of the isotope-labeled peptides. The distinct structural
changes are observed for V17 by going from broad unstructured patterns during the
lag-phase [random coil, (b)] to sharp peaks [beta-sheet, (c)] upon equilibrated fibril
formation. Contrasting to that, labeling F23 in the backbone resulted during the lagphase, (d), in a combination of broad random-coil peaks and a sharp isotope-label
peak (red arrow, \ 1600 cm
-1 ). These features evolved to a broad and featureless
Fig. 7 Fibril formation in the human islet amyloid polypeptide (hIAPP). a Sequence and solid-state
NMR model. b–e 2D IR spectra and diagonal slices of hIAPP during fibril formation. V17 and F23
indicate the
13
C
18 O isotope-labelled part of the sample (boxes and red arrows). f Kinetics of the unlabeled
beta-sheet and isotope-labelled F23 during fibril formation. g Energy scheme for the hIAPP aggregation.
Adapted with permission from Ref. [90]. Copyright National Academy of Science (2013)
Top Curr Chem (Z) (2017) 375:86
123
132
Reprinted from the journal
13 C
18 O isotope-labeled to obtain residue-specific structural
information and to break the vibrational coupling of the amide-I modes along the
protein backbone. Figure 7b–e shows the corresponding 2D IR spectra and diagonal
slices of exemplarily-labeled peptides of the so-called lag-phase [(b)/(d)] and the
equilibrated phase [(c)/(e)] during fibril formation. The white boxes and red arrows
indicate the spectral position of the isotope-labeled peptides. The distinct structural
changes are observed for V17 by going from broad unstructured patterns during the
lag-phase [random coil, (b)] to sharp peaks [beta-sheet, (c)] upon equilibrated fibril
formation. Contrasting to that, labeling F23 in the backbone resulted during the lagphase, (d), in a combination of broad random-coil peaks and a sharp isotope-label
peak (red arrow, \ 1600 cm
-1 ). These features evolved to a broad and featureless
Fig. 7 Fibril formation in the human islet amyloid polypeptide (hIAPP). a Sequence and solid-state
NMR model. b–e 2D IR spectra and diagonal slices of hIAPP during fibril formation. V17 and F23
indicate the
13
C
18 O isotope-labelled part of the sample (boxes and red arrows). f Kinetics of the unlabeled
beta-sheet and isotope-labelled F23 during fibril formation. g Energy scheme for the hIAPP aggregation.
Adapted with permission from Ref. [90]. Copyright National Academy of Science (2013)
Top Curr Chem (Z) (2017) 375:86
123
132
Reprinted from the journal