

without mechanical, electrodynamic or other quantum contributions, is still possibly
the most widely used model to interpret electrostatic coupling in 2D IR spectra and
often yields acceptable results for the description of molecular signals (Sect. 3.1.1)
[10].
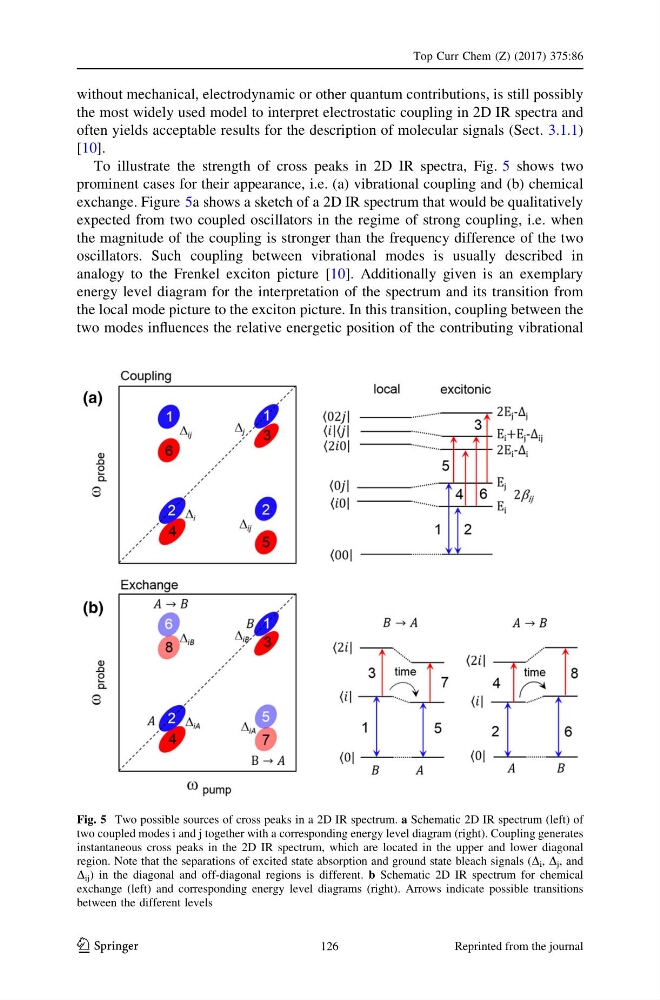
To illustrate the strength of cross peaks in 2D IR spectra, Fig. 5 shows two
prominent cases for their appearance, i.e. (a) vibrational coupling and (b) chemical
exchange. Figure 5a shows a sketch of a 2D IR spectrum that would be qualitatively
expected from two coupled oscillators in the regime of strong coupling, i.e. when
the magnitude of the coupling is stronger than the frequency difference of the two
oscillators. Such coupling between vibrational modes is usually described in
analogy to the Frenkel exciton picture [10]. Additionally given is an exemplary
energy level diagram for the interpretation of the spectrum and its transition from
the local mode picture to the exciton picture. In this transition, coupling between the
two modes influences the relative energetic position of the contributing vibrational
Fig. 5 Two possible sources of cross peaks in a 2D IR spectrum. a Schematic 2D IR spectrum (left) of
two coupled modes i and j together with a corresponding energy level diagram (right). Coupling generates
instantaneous cross peaks in the 2D IR spectrum, which are located in the upper and lower diagonal
region. Note that the separations of excited state absorption and ground state bleach signals (D i , D j , and
D ij ) in the diagonal and off-diagonal regions is different. b Schematic 2D IR spectrum for chemical
exchange (left) and corresponding energy level diagrams (right). Arrows indicate possible transitions
between the different levels
Top Curr Chem (Z) (2017) 375:86
123
126
Reprinted from the journal
the most widely used model to interpret electrostatic coupling in 2D IR spectra and
often yields acceptable results for the description of molecular signals (Sect. 3.1.1)
[10].
To illustrate the strength of cross peaks in 2D IR spectra, Fig. 5 shows two
prominent cases for their appearance, i.e. (a) vibrational coupling and (b) chemical
exchange. Figure 5a shows a sketch of a 2D IR spectrum that would be qualitatively
expected from two coupled oscillators in the regime of strong coupling, i.e. when
the magnitude of the coupling is stronger than the frequency difference of the two
oscillators. Such coupling between vibrational modes is usually described in
analogy to the Frenkel exciton picture [10]. Additionally given is an exemplary
energy level diagram for the interpretation of the spectrum and its transition from
the local mode picture to the exciton picture. In this transition, coupling between the
two modes influences the relative energetic position of the contributing vibrational
Fig. 5 Two possible sources of cross peaks in a 2D IR spectrum. a Schematic 2D IR spectrum (left) of
two coupled modes i and j together with a corresponding energy level diagram (right). Coupling generates
instantaneous cross peaks in the 2D IR spectrum, which are located in the upper and lower diagonal
region. Note that the separations of excited state absorption and ground state bleach signals (D i , D j , and
D ij ) in the diagonal and off-diagonal regions is different. b Schematic 2D IR spectrum for chemical
exchange (left) and corresponding energy level diagrams (right). Arrows indicate possible transitions
between the different levels
Top Curr Chem (Z) (2017) 375:86
123
126
Reprinted from the journal