

As one of the most powerful aspects, 2D IR spectra at a series of population
delays can report on the dynamics of the sample. Variations of the sample
conditions (e.g., solvent, temperature, pressure) can then be used to elucidate the
influence of the environment on the ultrafast dynamics. The most obvious
information that can be obtained from the intensity of the peaks is the dynamics
of vibrational relaxation. After pumping the vibrational transition, vibrational
relaxation diminishes the signals over time due to repopulation of the ground state
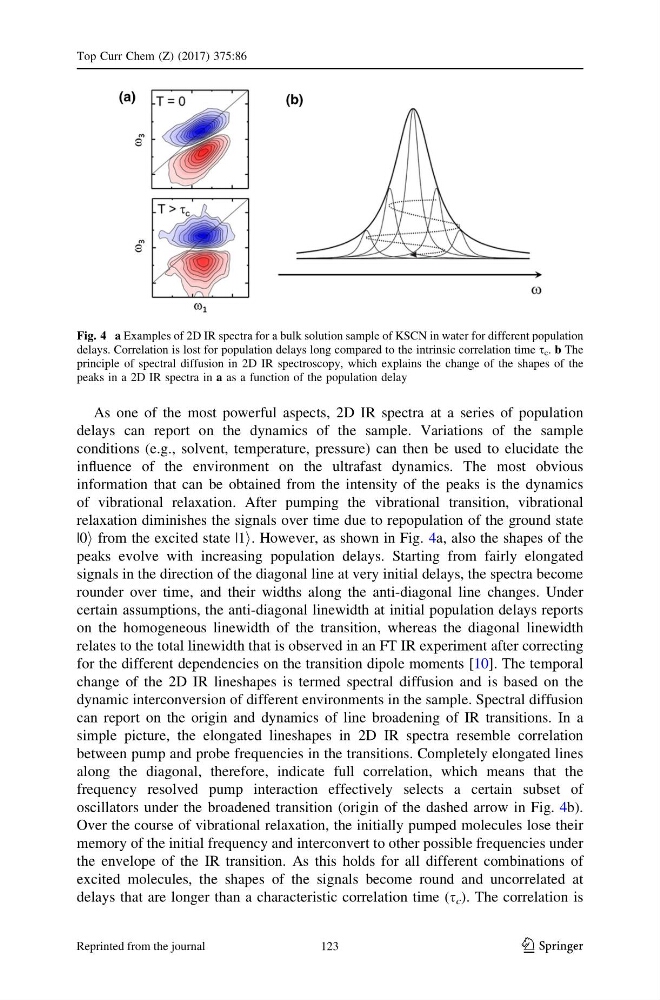
|0i from the excited state |1i. However, as shown in Fig. 4a, also the shapes of the
peaks evolve with increasing population delays. Starting from fairly elongated
signals in the direction of the diagonal line at very initial delays, the spectra become
rounder over time, and their widths along the anti-diagonal line changes. Under
certain assumptions, the anti-diagonal linewidth at initial population delays reports
on the homogeneous linewidth of the transition, whereas the diagonal linewidth
relates to the total linewidth that is observed in an FT IR experiment after correcting
for the different dependencies on the transition dipole moments [10]. The temporal
change of the 2D IR lineshapes is termed spectral diffusion and is based on the
dynamic interconversion of different environments in the sample. Spectral diffusion
can report on the origin and dynamics of line broadening of IR transitions. In a
simple picture, the elongated lineshapes in 2D IR spectra resemble correlation
between pump and probe frequencies in the transitions. Completely elongated lines
along the diagonal, therefore, indicate full correlation, which means that the
frequency resolved pump interaction effectively selects a certain subset of
oscillators under the broadened transition (origin of the dashed arrow in Fig. 4b).
Over the course of vibrational relaxation, the initially pumped molecules lose their
memory of the initial frequency and interconvert to other possible frequencies under
the envelope of the IR transition. As this holds for all different combinations of
excited molecules, the shapes of the signals become round and uncorrelated at
delays that are longer than a characteristic correlation time (s c ). The correlation is
Fig. 4 a Examples of 2D IR spectra for a bulk solution sample of KSCN in water for different population
delays. Correlation is lost for population delays long compared to the intrinsic correlation time s c . b The
principle of spectral diffusion in 2D IR spectroscopy, which explains the change of the shapes of the
peaks in a 2D IR spectra in a as a function of the population delay
Top Curr Chem (Z) (2017) 375:86
123
123
Reprinted from the journal
delays can report on the dynamics of the sample. Variations of the sample
conditions (e.g., solvent, temperature, pressure) can then be used to elucidate the
influence of the environment on the ultrafast dynamics. The most obvious
information that can be obtained from the intensity of the peaks is the dynamics
of vibrational relaxation. After pumping the vibrational transition, vibrational
relaxation diminishes the signals over time due to repopulation of the ground state
|0i from the excited state |1i. However, as shown in Fig. 4a, also the shapes of the
peaks evolve with increasing population delays. Starting from fairly elongated
signals in the direction of the diagonal line at very initial delays, the spectra become
rounder over time, and their widths along the anti-diagonal line changes. Under
certain assumptions, the anti-diagonal linewidth at initial population delays reports
on the homogeneous linewidth of the transition, whereas the diagonal linewidth
relates to the total linewidth that is observed in an FT IR experiment after correcting
for the different dependencies on the transition dipole moments [10]. The temporal
change of the 2D IR lineshapes is termed spectral diffusion and is based on the
dynamic interconversion of different environments in the sample. Spectral diffusion
can report on the origin and dynamics of line broadening of IR transitions. In a
simple picture, the elongated lineshapes in 2D IR spectra resemble correlation
between pump and probe frequencies in the transitions. Completely elongated lines
along the diagonal, therefore, indicate full correlation, which means that the
frequency resolved pump interaction effectively selects a certain subset of
oscillators under the broadened transition (origin of the dashed arrow in Fig. 4b).
Over the course of vibrational relaxation, the initially pumped molecules lose their
memory of the initial frequency and interconvert to other possible frequencies under
the envelope of the IR transition. As this holds for all different combinations of
excited molecules, the shapes of the signals become round and uncorrelated at
delays that are longer than a characteristic correlation time (s c ). The correlation is
Fig. 4 a Examples of 2D IR spectra for a bulk solution sample of KSCN in water for different population
delays. Correlation is lost for population delays long compared to the intrinsic correlation time s c . b The
principle of spectral diffusion in 2D IR spectroscopy, which explains the change of the shapes of the
peaks in a 2D IR spectra in a as a function of the population delay
Top Curr Chem (Z) (2017) 375:86
123
123
Reprinted from the journal