

64
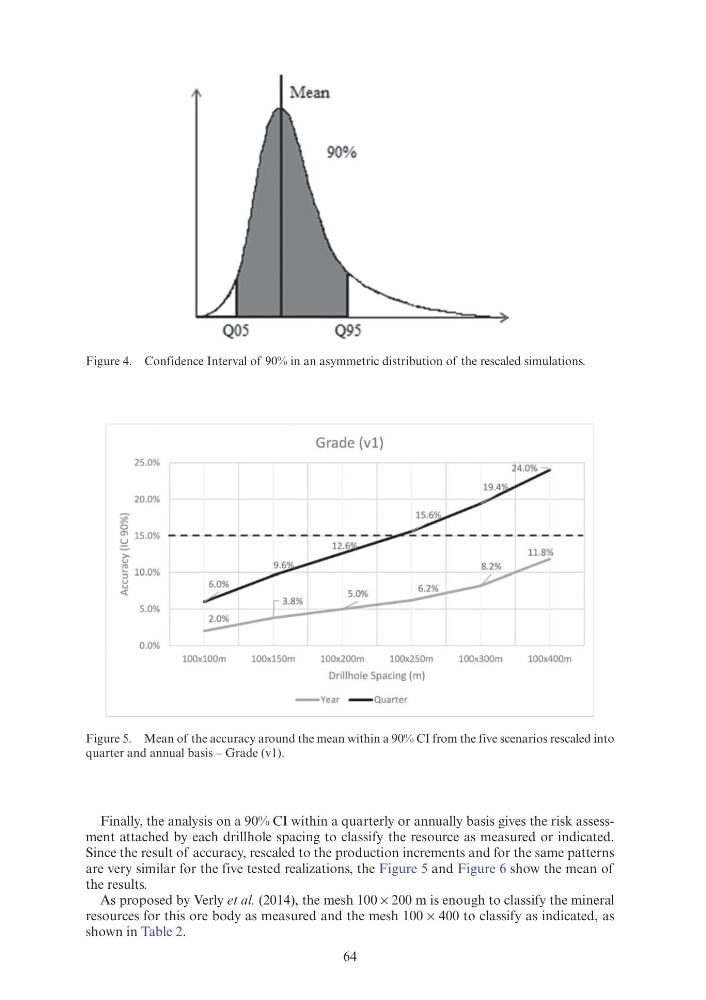
Finally, the analysis on a 90% CI within a quarterly or annually basis gives the risk assessment attached by each drillhole spacing to classify the resource as measured or indicated.
Since the result of accuracy, rescaled to the production increments and for the same patterns
are very similar for the five tested realizations, the Figure 5 and Figure 6 show the mean of
the results.
As proposed by Verly et al. (2014), the mesh 100 × 200 m is enough to classify the mineral
resources for this ore body as measured and the mesh 100 × 400 to classify as indicated, as
shown in Table 2.
Figure 4. Confidence Interval of 90% in an asymmetric distribution of the rescaled simulations.
Figure 5. Mean of the accuracy around the mean within a 90% CI from the five scenarios rescaled into
quarter and annual basis – Grade (v1).
25.0%
20.0%
~
0
~ 15.0%
> u
~ 10.0%
u
u
5.0%
0.0%
Q05
100x100m
Q95
Grade (vl)
100x150m
100x200m
100x250m
100x300m
100x400m
Drillhole Spacing (m)
-
Year -
Quarter
Finally, the analysis on a 90% CI within a quarterly or annually basis gives the risk assessment attached by each drillhole spacing to classify the resource as measured or indicated.
Since the result of accuracy, rescaled to the production increments and for the same patterns
are very similar for the five tested realizations, the Figure 5 and Figure 6 show the mean of
the results.
As proposed by Verly et al. (2014), the mesh 100 × 200 m is enough to classify the mineral
resources for this ore body as measured and the mesh 100 × 400 to classify as indicated, as
shown in Table 2.
Figure 4. Confidence Interval of 90% in an asymmetric distribution of the rescaled simulations.
Figure 5. Mean of the accuracy around the mean within a 90% CI from the five scenarios rescaled into
quarter and annual basis – Grade (v1).
25.0%
20.0%
~
0
~ 15.0%
> u
~ 10.0%
u
u
5.0%
0.0%
Q05
100x100m
Q95
Grade (vl)
100x150m
100x200m
100x250m
100x300m
100x400m
Drillhole Spacing (m)
-
Year -
Quarter