

650
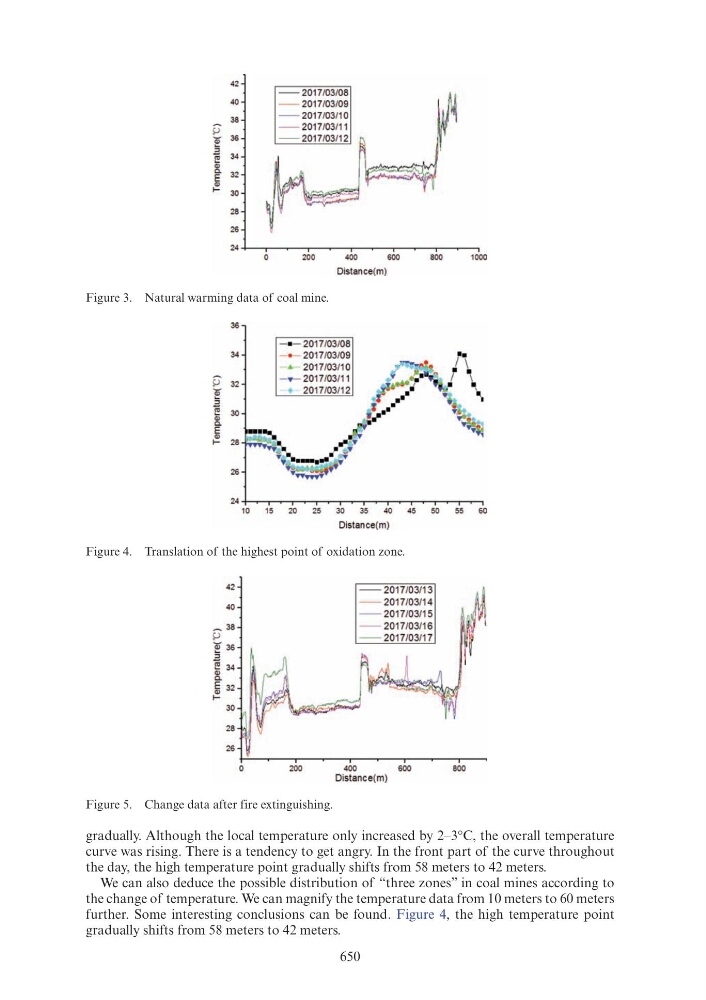
Figure 3. Natural warming data of coal mine.
Figure 4. Translation of the highest point of oxidation zone.
Figure 5. Change data after fire extinguishing.
gradually. Although the local temperature only increased by 2–3°C, the overall temperature
curve was rising. There is a tendency to get angry. In the front part of the curve throughout
the day, the high temperature point gradually shifts from 58 meters to 42 meters.
We can also deduce the possible distribution of “three zones” in coal mines according to
the change of temperature. We can magnify the temperature data from 10 meters to 60 meters
further. Some interesting conclusions can be found. Figure 4, the high temperature point
gradually shifts from 58 meters to 42 meters.
42
- - 2017/03/08
40
- - 2017/03/09
3B
- - 2017/03/10
~
- - 2017/03/11
Q) 36
- - 2017/03/12
.3 34
~
"' a.
E 32
"'
f30
2B
26
24
200
400
600
BOO
1000
Distance(m)
36
- · - 2017/03/08
34
- · - 2017/03/09
- .t.- 2017/0311 0
p 32
-~ 2017/03111
'f
- 2017/0311 2
.2
~
"'
30
a.
E
"'
f2B
26
24 +-~,-~.-~.-~~--~-,~-.~-.~-.~42
40
~ 3B
p
~ 36
:::>
"§ 34
Q)
a.
~ 32
f30
2B
26
10
15
20
25
30
35
40
45
50
55
60
Distance(m)
--2017/0311 3
- - 2017/0311 4
- - 2017/0311 5
- - 2017/0311 6
- - 2017/0311 7
200
400
600
BOO
Distance(m)