

638
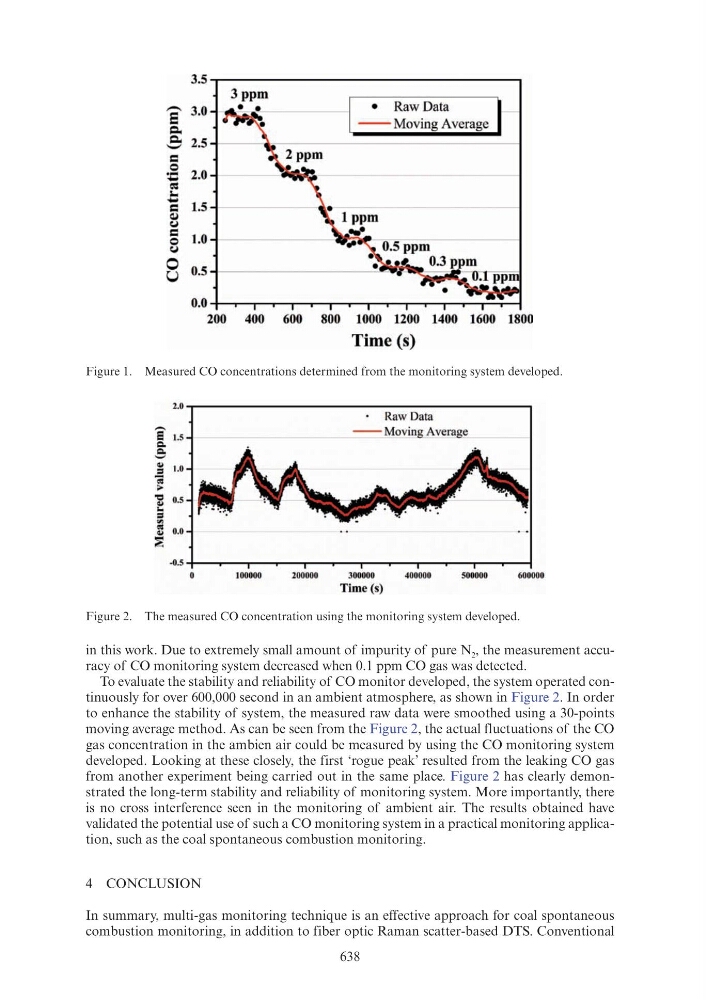
Figure 1. Measured CO concentrations determined from the monitoring system developed.
Figure 2. The measured CO concentration using the monitoring system developed.
in this work. Due to extremely small amount of impurity of pure N 2 , the measurement accuracy of CO monitoring system decreased when 0.1 ppm CO gas was detected.
To evaluate the stability and reliability of CO monitor developed, the system operated continuously for over 600,000 second in an ambient atmosphere, as shown in Figure 2. In order
to enhance the stability of system, the measured raw data were smoothed using a 30-points
moving average method. As can be seen from the Figure 2, the actual fluctuations of the CO
gas concentration in the ambien air could be measured by using the CO monitoring system
developed. Looking at these closely, the first ‘rogue peak’ resulted from the leaking CO gas
from another experiment being carried out in the same place. Figure 2 has clearly demonstrated the long-term stability and reliability of monitoring system. More importantly, there
is no cross interference seen in the monitoring of ambient air. The results obtained have
validated the potential use of such a CO monitoring system in a practical monitoring application, such as the coal spontaneous combustion monitoring.
4 CONCLUSION
In summary, multi-gas monitoring technique is an effective approach for coal spontaneous
combustion monitoring, in addition to fiber optic Raman scatter-based DTS. Conventional
3.5
3ppm
-3.0
• Raw Data
E
- - Moving Average
=.. Q., 2.5
- =
0
2.0
.... .....
~
I..
..... 1.5
= Q;l
~
= 1.0
0
~
0 0.5
u
0.0
200 400 600 800 1000 1200 1400 1600 1800
Time (s)
2.0
Raw Data
,-._
6 1.5
- - Moving Average
=- ='-'
~
1.0
.E «!
~
"0 0.5
~
.. =
"' «! 0.0
~
~
-0.5
100000
200000
300000
400000
500000
600000
Time (s)